This function inserts calculated odds ratios of GAM(M)s into a plot of a GAM(M) smoothing function.
Usage
insert_or(
  plot_object = NULL,
  or_object = NULL,
  line_col = "red",
  line_size = 1.2,
  line_type = "solid",
  line_alpha = 1,
  text_alpha = 1,
  text_size = 4,
  text_col = "black",
  rect_alpha = 0.5,
  rect_col = NULL,
  rect = FALSE,
  arrow = TRUE,
  values = TRUE,
  values_yloc = 0,
  values_xloc = NULL,
  or_yloc = 0,
  arrow_length = NULL,
  arrow_yloc = NULL,
  arrow_col = NULL,
  arrow_xloc_r = NULL,
  arrow_xloc_l = NULL
)
Arguments
- plot_object
A
ggplotobject fromplot_gam().- or_object
A data.frame as returned from
or_gam().- line_col, line_alpha, line_type, line_size
Aesthetics of vertical lines.
- text_col, text_alpha, text_size
Aesthetics of inserted values.
- rect_col, rect_alpha
Aesthetics of shaded rectangle.
- rect
Whether to print a shaded rectangle between the vertical lines.
- arrow
Whether to print arrows above the inserted values.
- values
Whether to print predictor value information nearby the inserted vertical lines.
- values_xloc
x-axis location/shift of values relative to their vertical line. Default to 2\% of x-axis range.
- or_yloc, values_yloc
Specifies y-location of inserted odds ratio values. Relative to plotted y-axis range. A positive (negative) value will place the the text higher (lower).
- arrow_xloc_r, arrow_xloc_l, arrow_yloc, arrow_length, arrow_col
Axis placement options of inserted arrows. Relative to respective axis ranges.
Details
The idea behind this function is to add calculated odds ratios of fitted GAM
models (or_gam()) into a plot showing the smooth function (plot_gam) of
the chosen predictor for which the odds ratio was calculated for. Multiple
insertions can be made by iterative calling the function (see examples).
Right now the function only accepts inputs from or_gam() objects with
slice = FALSE. If you want to insert multiple odds ratio values, call the
function multiple times.
Examples
library(oddsratio)
library(mgcv)
fit_gam <- gam(y ~ s(x0) + s(I(x1^2)) + s(x2) +
offset(x3) + x4, data = data_gam) # fit model
# create input objects (plot + odds ratios)
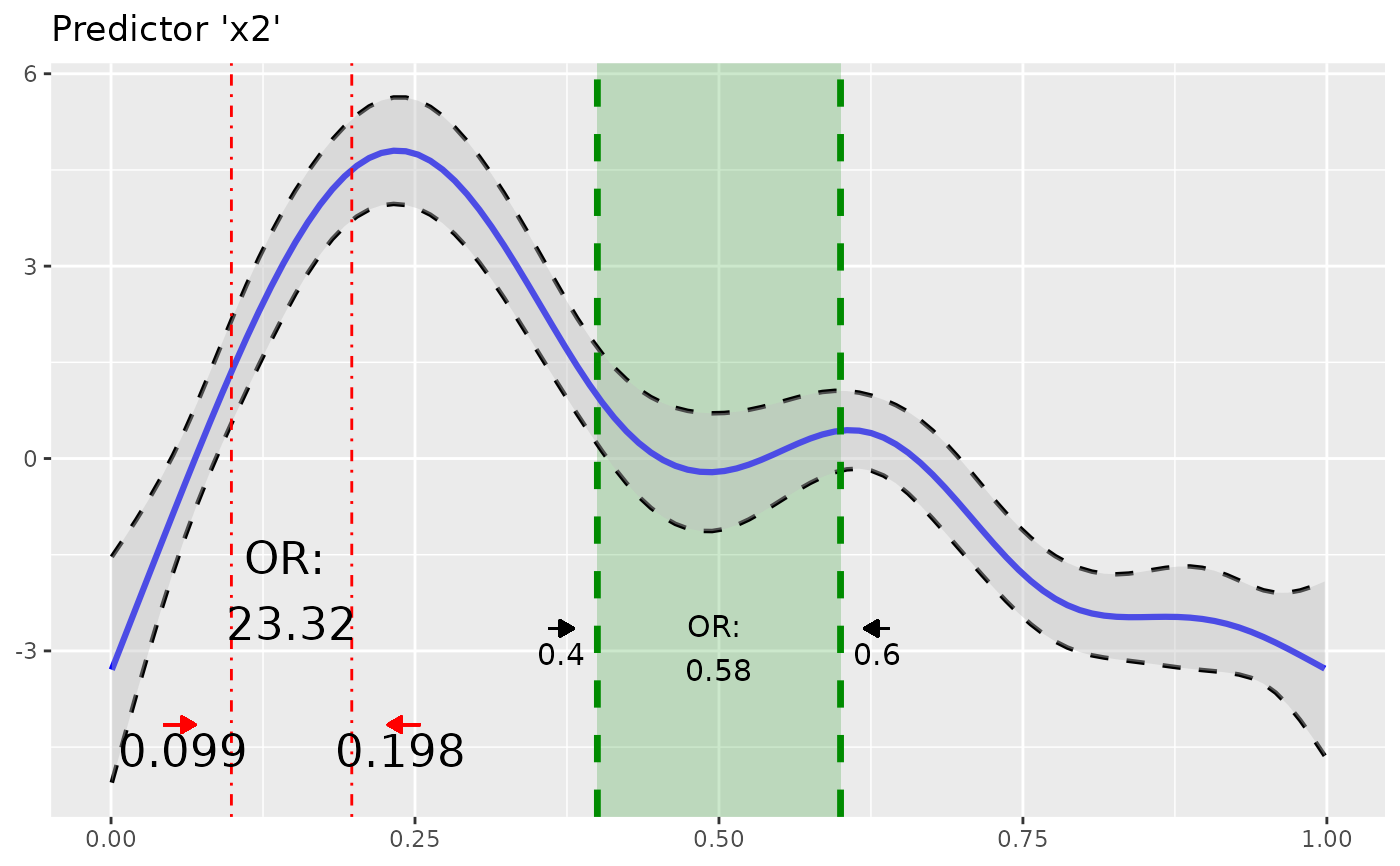
plot_object <- plot_gam(fit_gam, pred = "x2", title = "Predictor 'x2'")
or_object1 <- or_gam(
data = data_gam, model = fit_gam,
pred = "x2", values = c(0.099, 0.198)
)
# insert first odds ratios to plot
plot_object <- insert_or(plot_object, or_object1,
or_yloc = 3,
values_xloc = 0.04, line_size = 0.5,
line_type = "dotdash", text_size = 6,
values_yloc = 0.5, arrow_col = "red"
)
# calculate second odds ratio
or_object2 <- or_gam(
data = data_gam, model = fit_gam, pred = "x2",
values = c(0.4, 0.6)
)
# add or_object2 into plot
insert_or(plot_object, or_object2,
or_yloc = 2.1, values_yloc = 2,
line_col = "green4", text_col = "black",
rect_col = "green4", rect_alpha = 0.2,
line_alpha = 1, line_type = "dashed",
arrow_xloc_r = 0.01, arrow_xloc_l = -0.01,
arrow_length = 0.01, rect = TRUE
)