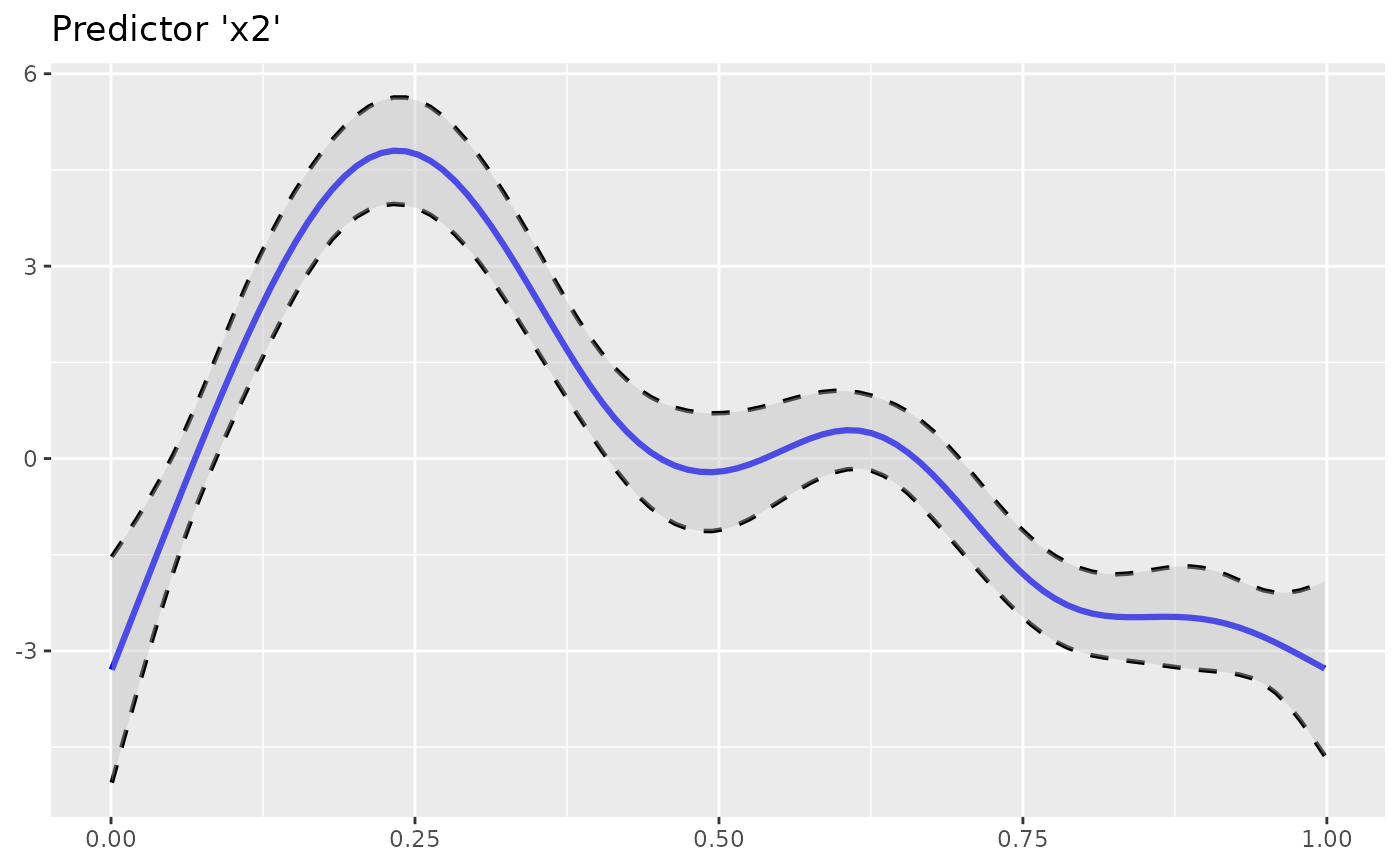
Plots the smoothing function of GAM(M) predictors via ggplot2
Usage
plot_gam(
  model = NULL,
  pred = NULL,
  col_line = "blue",
  ci_line_col = "black",
  ci_line_type = "dashed",
  ci_fill = "grey",
  ci_alpha = 0.4,
  ci_line_size = 0.8,
  sm_fun_size = 1.1,
  title = NULL,
  xlab = NULL,
  ylab = NULL,
  limits_y = NULL,
  breaks_y = NULL
)
Arguments
- model
A fitted model of class
gam.- pred
Predictor name.
- col_line
Smoothing function line color.
- ci_line_col
Confident interval line color.
- ci_line_type
Linetype of confidence interval.
- ci_fill
Fill color of area between smoothing function and its confidence interval lines.
- ci_alpha
Opacity value of confidence interval.
- ci_line_size, sm_fun_size
Line sizes.
- title
Plot title.
- xlab
x-axis title.
- ylab
y-axis title.
- limits_y
y-axis limits.
- breaks_y
y-axis breaks. Values are handed over to a
seqcall, e.g.seq(-6, 6, 2).