Last updated: 2019-05-28
Checks: 6 0
Knit directory: 2018-model-comparison/
This reproducible R Markdown analysis was created with workflowr (version 1.3.0). The Checks tab describes the reproducibility checks that were applied when the results were created. The Past versions tab lists the development history.
Great! Since the R Markdown file has been committed to the Git repository, you know the exact version of the code that produced these results.
Great job! The global environment was empty. Objects defined in the global environment can affect the analysis in your R Markdown file in unknown ways. For reproduciblity it’s best to always run the code in an empty environment.
The command set.seed(20190523) was run prior to running the code in the R Markdown file. Setting a seed ensures that any results that rely on randomness, e.g. subsampling or permutations, are reproducible.
Great job! Recording the operating system, R version, and package versions is critical for reproducibility.
Nice! There were no cached chunks for this analysis, so you can be confident that you successfully produced the results during this run.
Great! You are using Git for version control. Tracking code development and connecting the code version to the results is critical for reproducibility. The version displayed above was the version of the Git repository at the time these results were generated.
Note that you need to be careful to ensure that all relevant files for the analysis have been committed to Git prior to generating the results (you can use wflow_publish or wflow_git_commit). workflowr only checks the R Markdown file, but you know if there are other scripts or data files that it depends on. Below is the status of the Git repository when the results were generated:
Ignored files:
    Ignored:    .Rproj.user/
    Ignored:    .drake/
    Ignored:    code/07-paper/._files
    Ignored:    data/
    Ignored:    log/
    Ignored:    packrat/lib-R/
    Ignored:    packrat/lib-ext/
    Ignored:    packrat/lib/
    Ignored:    rosm.cache/
    Ignored:    tests/testthat/

Untracked files:
    Untracked:  packrat/src/drake/40af919c816b5ddd61b5280dda72d35dfa54cf73.tar.gz
    Untracked:  packrat/src/drake/drake_7.3.0.tar.gz

Unstaged changes:
    Modified:   .Rhistory
    Modified:   _drake.R
    Modified:   analysis/_site.yml
    Modified:   code/01-data/task.R
    Modified:   code/04-prediction/prediction.R
    Modified:   code/06-reports.R
    Modified:   code/07-paper/submission/3/latex-source-files/cv_boxplots_final_brier-1.pdf
    Modified:   docs/figure/benchmark-diplodia.Rmd/cv_boxplots_final_brier-1.pdf
    Modified:   packrat/packrat.lock
Note that any generated files, e.g. HTML, png, CSS, etc., are not included in this status report because it is ok for generated content to have uncommitted changes.
These are the previous versions of the R Markdown and HTML files. If you’ve configured a remote Git repository (see ?wflow_git_remote), click on the hyperlinks in the table below to view them.
| File | Version | Author | Date | Message |
|---|---|---|---|---|
| Rmd | 82bf724 | pat-s | 2019-05-28 | update site |
| html | 9d4f52e | pat-s | 2019-05-27 | Build site. |
| Rmd | 6257f3b | pat-s | 2019-05-27 | wflow_publish(knitr_in(“analysis/benchmark-pathogens.Rmd”), view = |
| Rmd | dac5d6a | pat-s | 2019-05-25 | upd reports |
| Rmd | 6af4181 | pat-s | 2019-05-23 | update reports |
| Rmd | 769718b | pat-s | 2019-05-23 | Start workflowr project. |
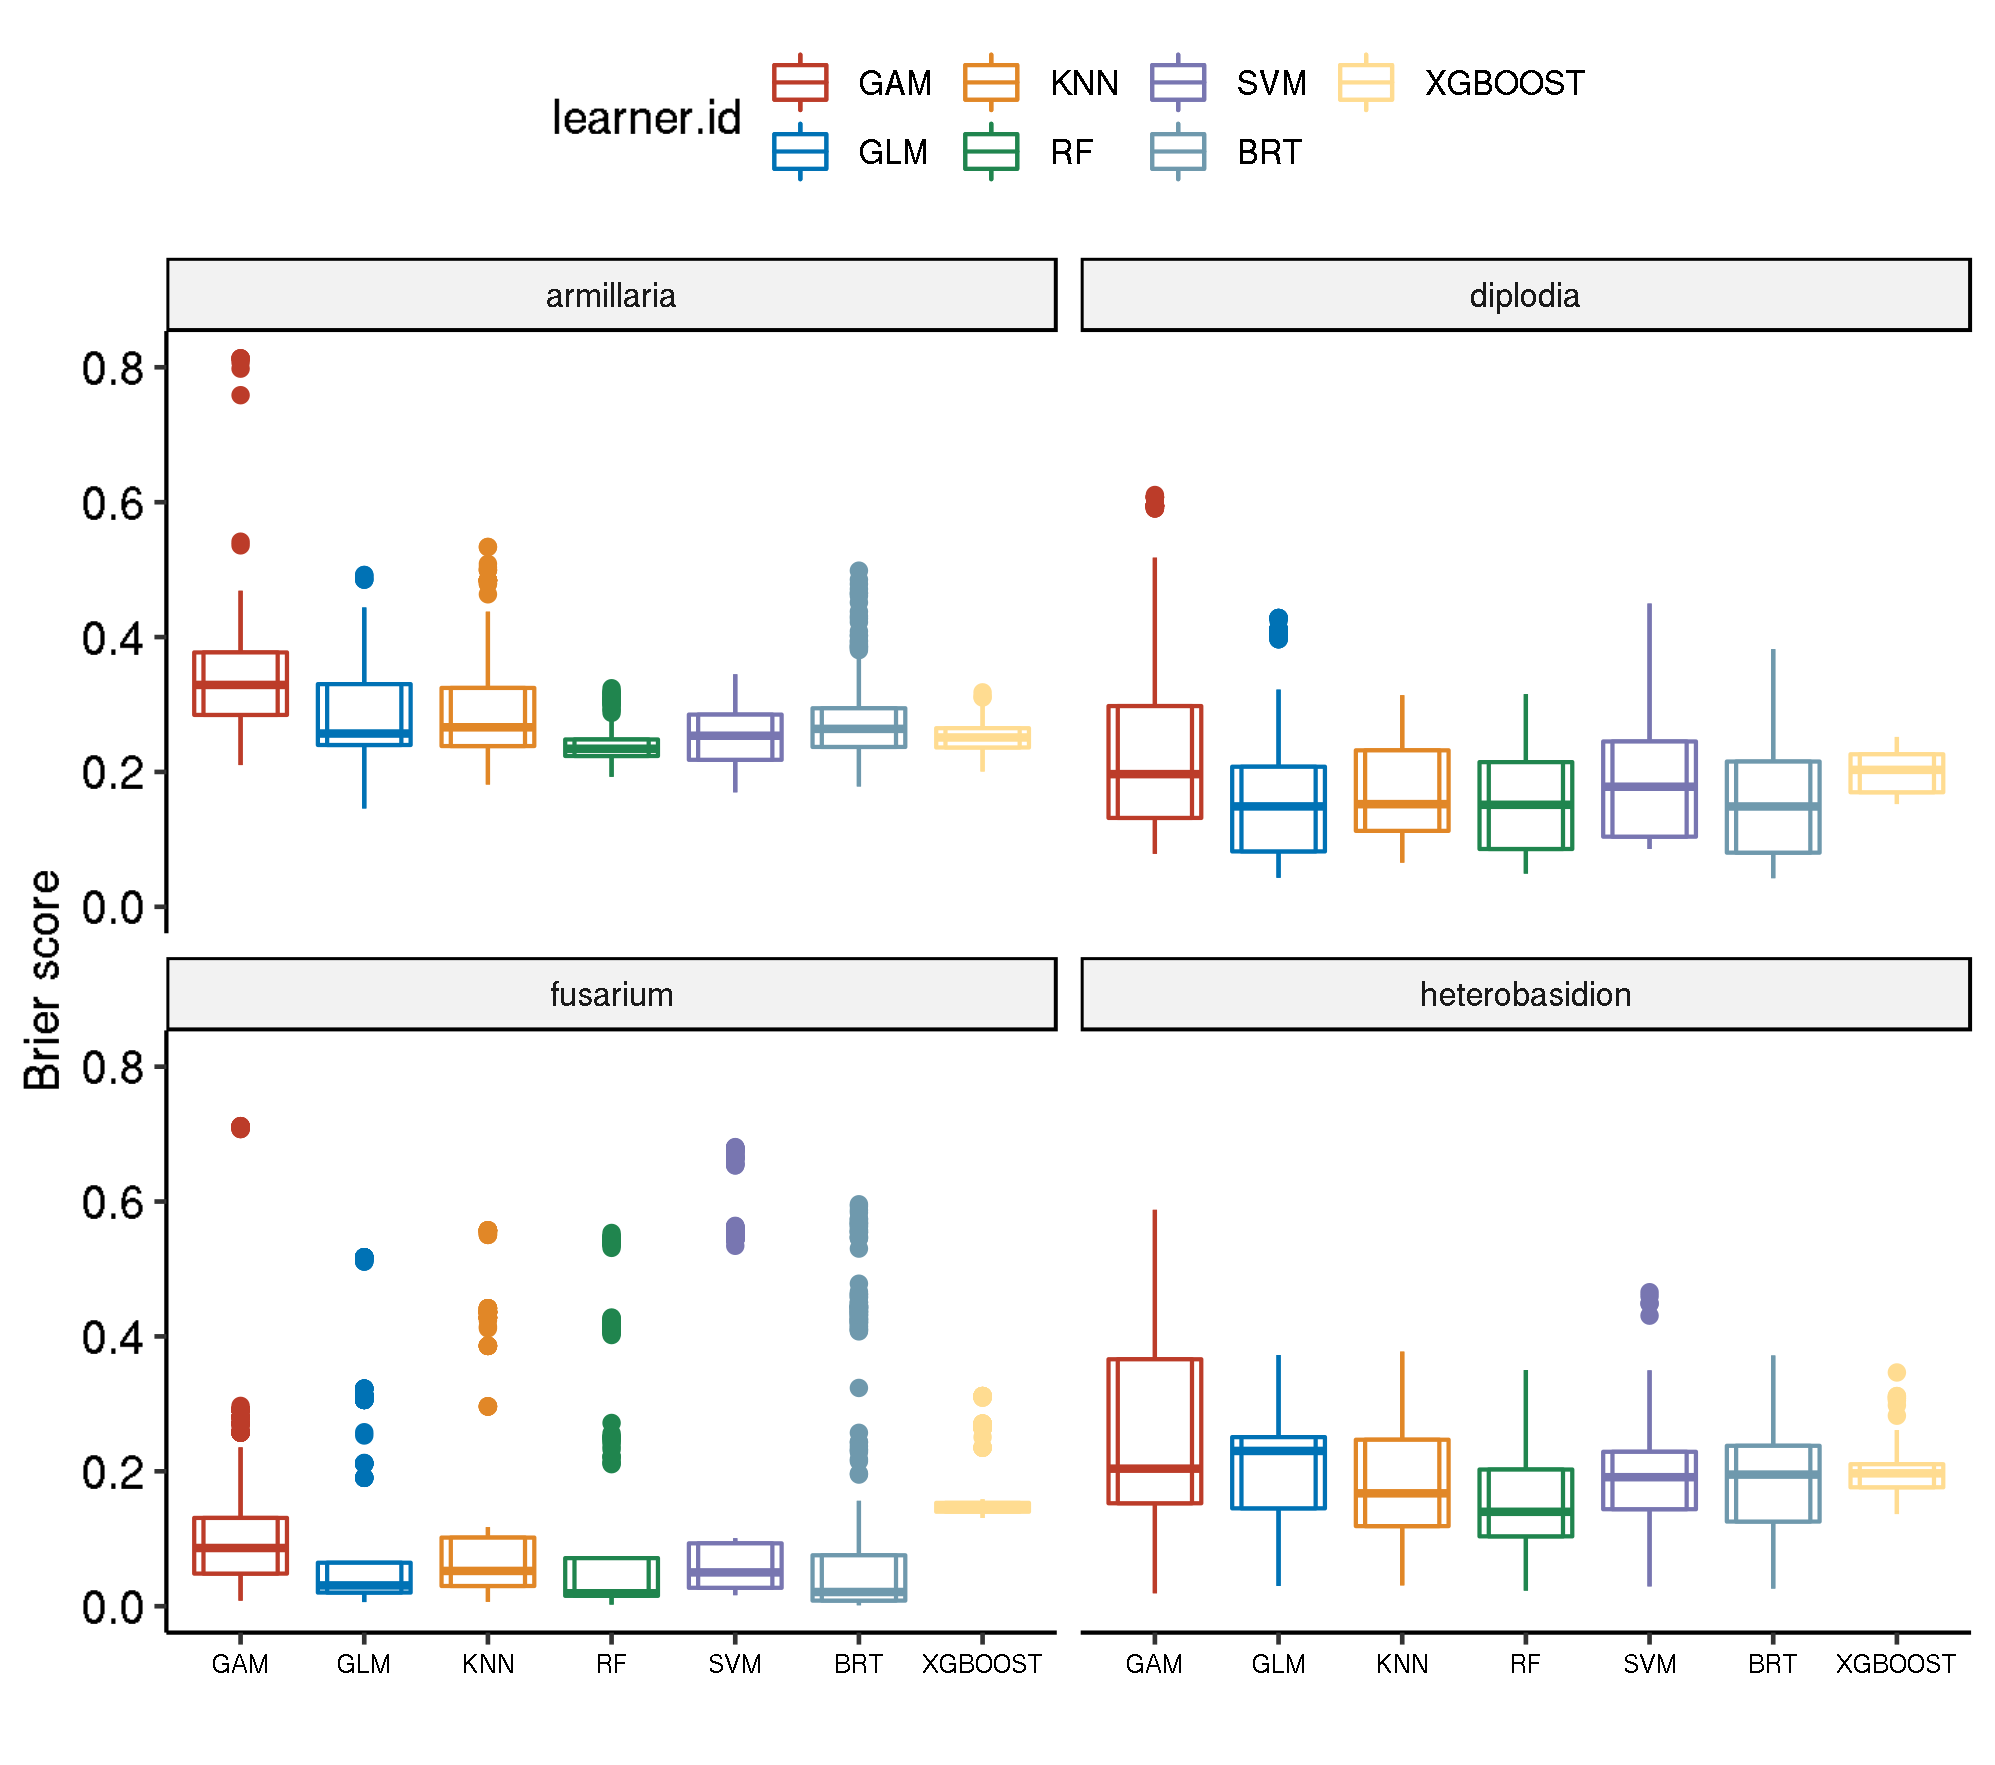
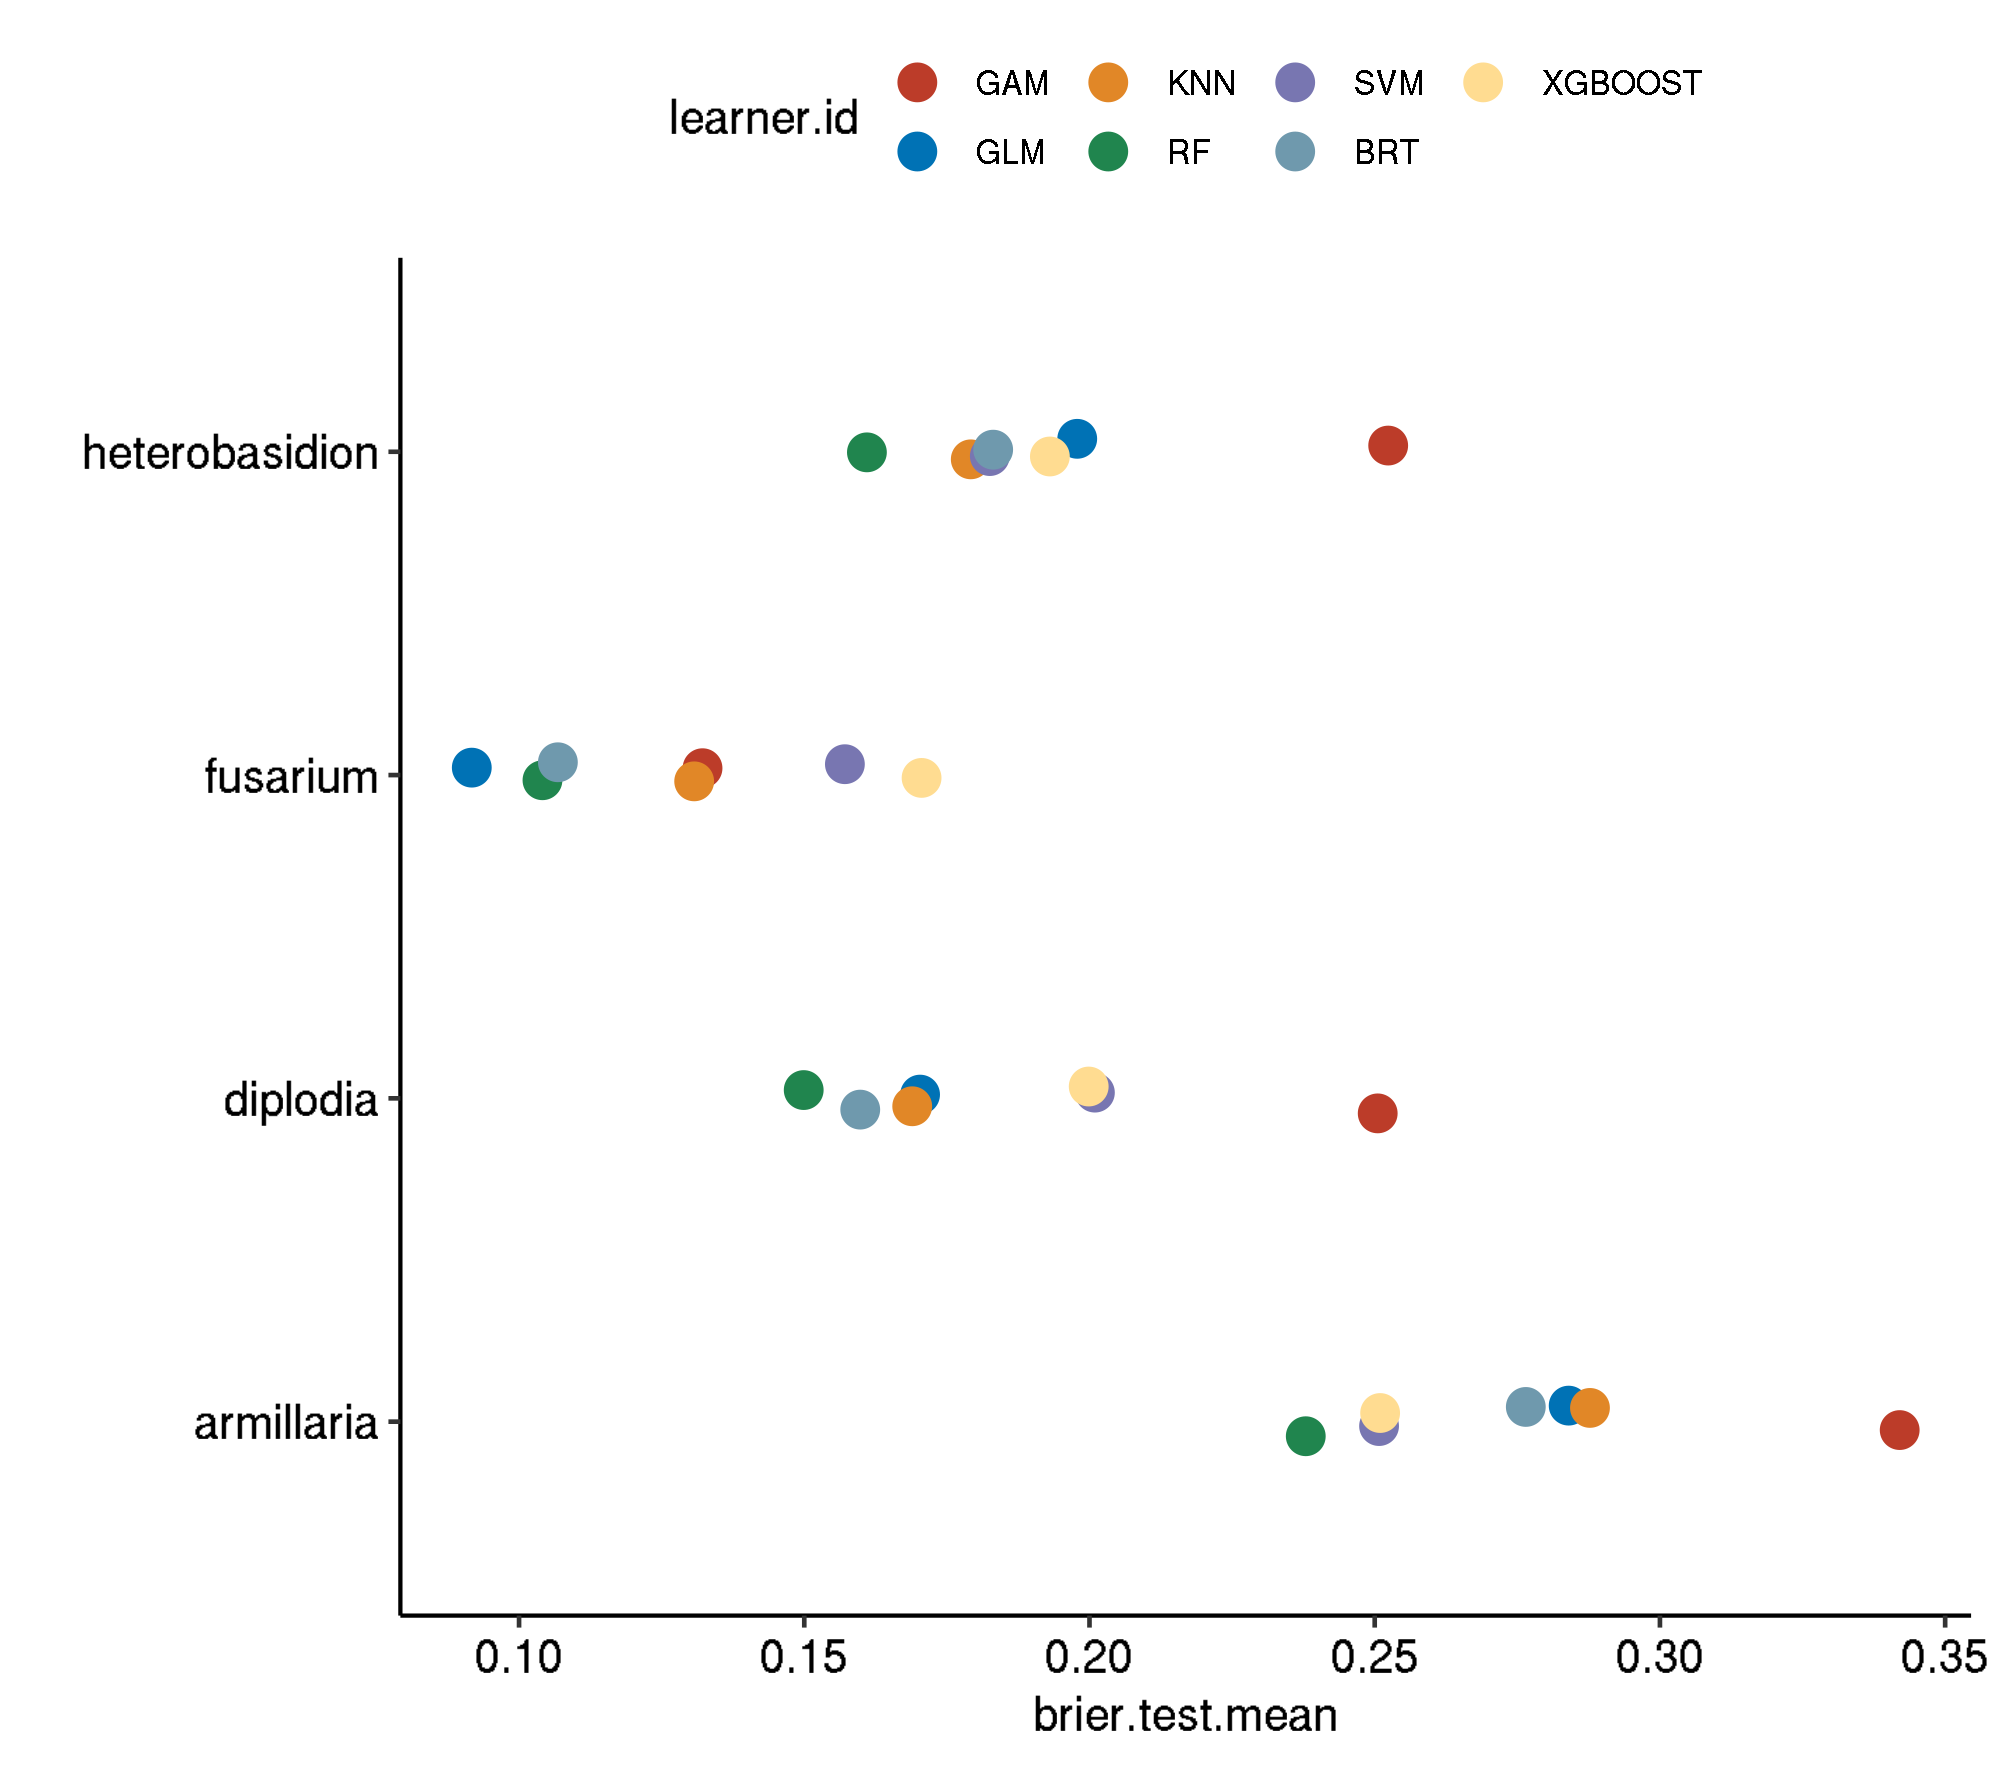
This document shows the predictive performances for the possible infection risk of trees in the Basque Country by the following pathogens:
The following algorithms were benchmarked:
The abbreviations of the tabbed resampling strategies follow the scheme:
<outer resampling> / <inner resampling>
For example, setting “Spatial-Spatial” means that in both levels a “spatial cross-validation” (Brenning (2012)) has been applied.
The inner resampling refers to the hyperparameter tuning level of the nested cross-validation that was applied.
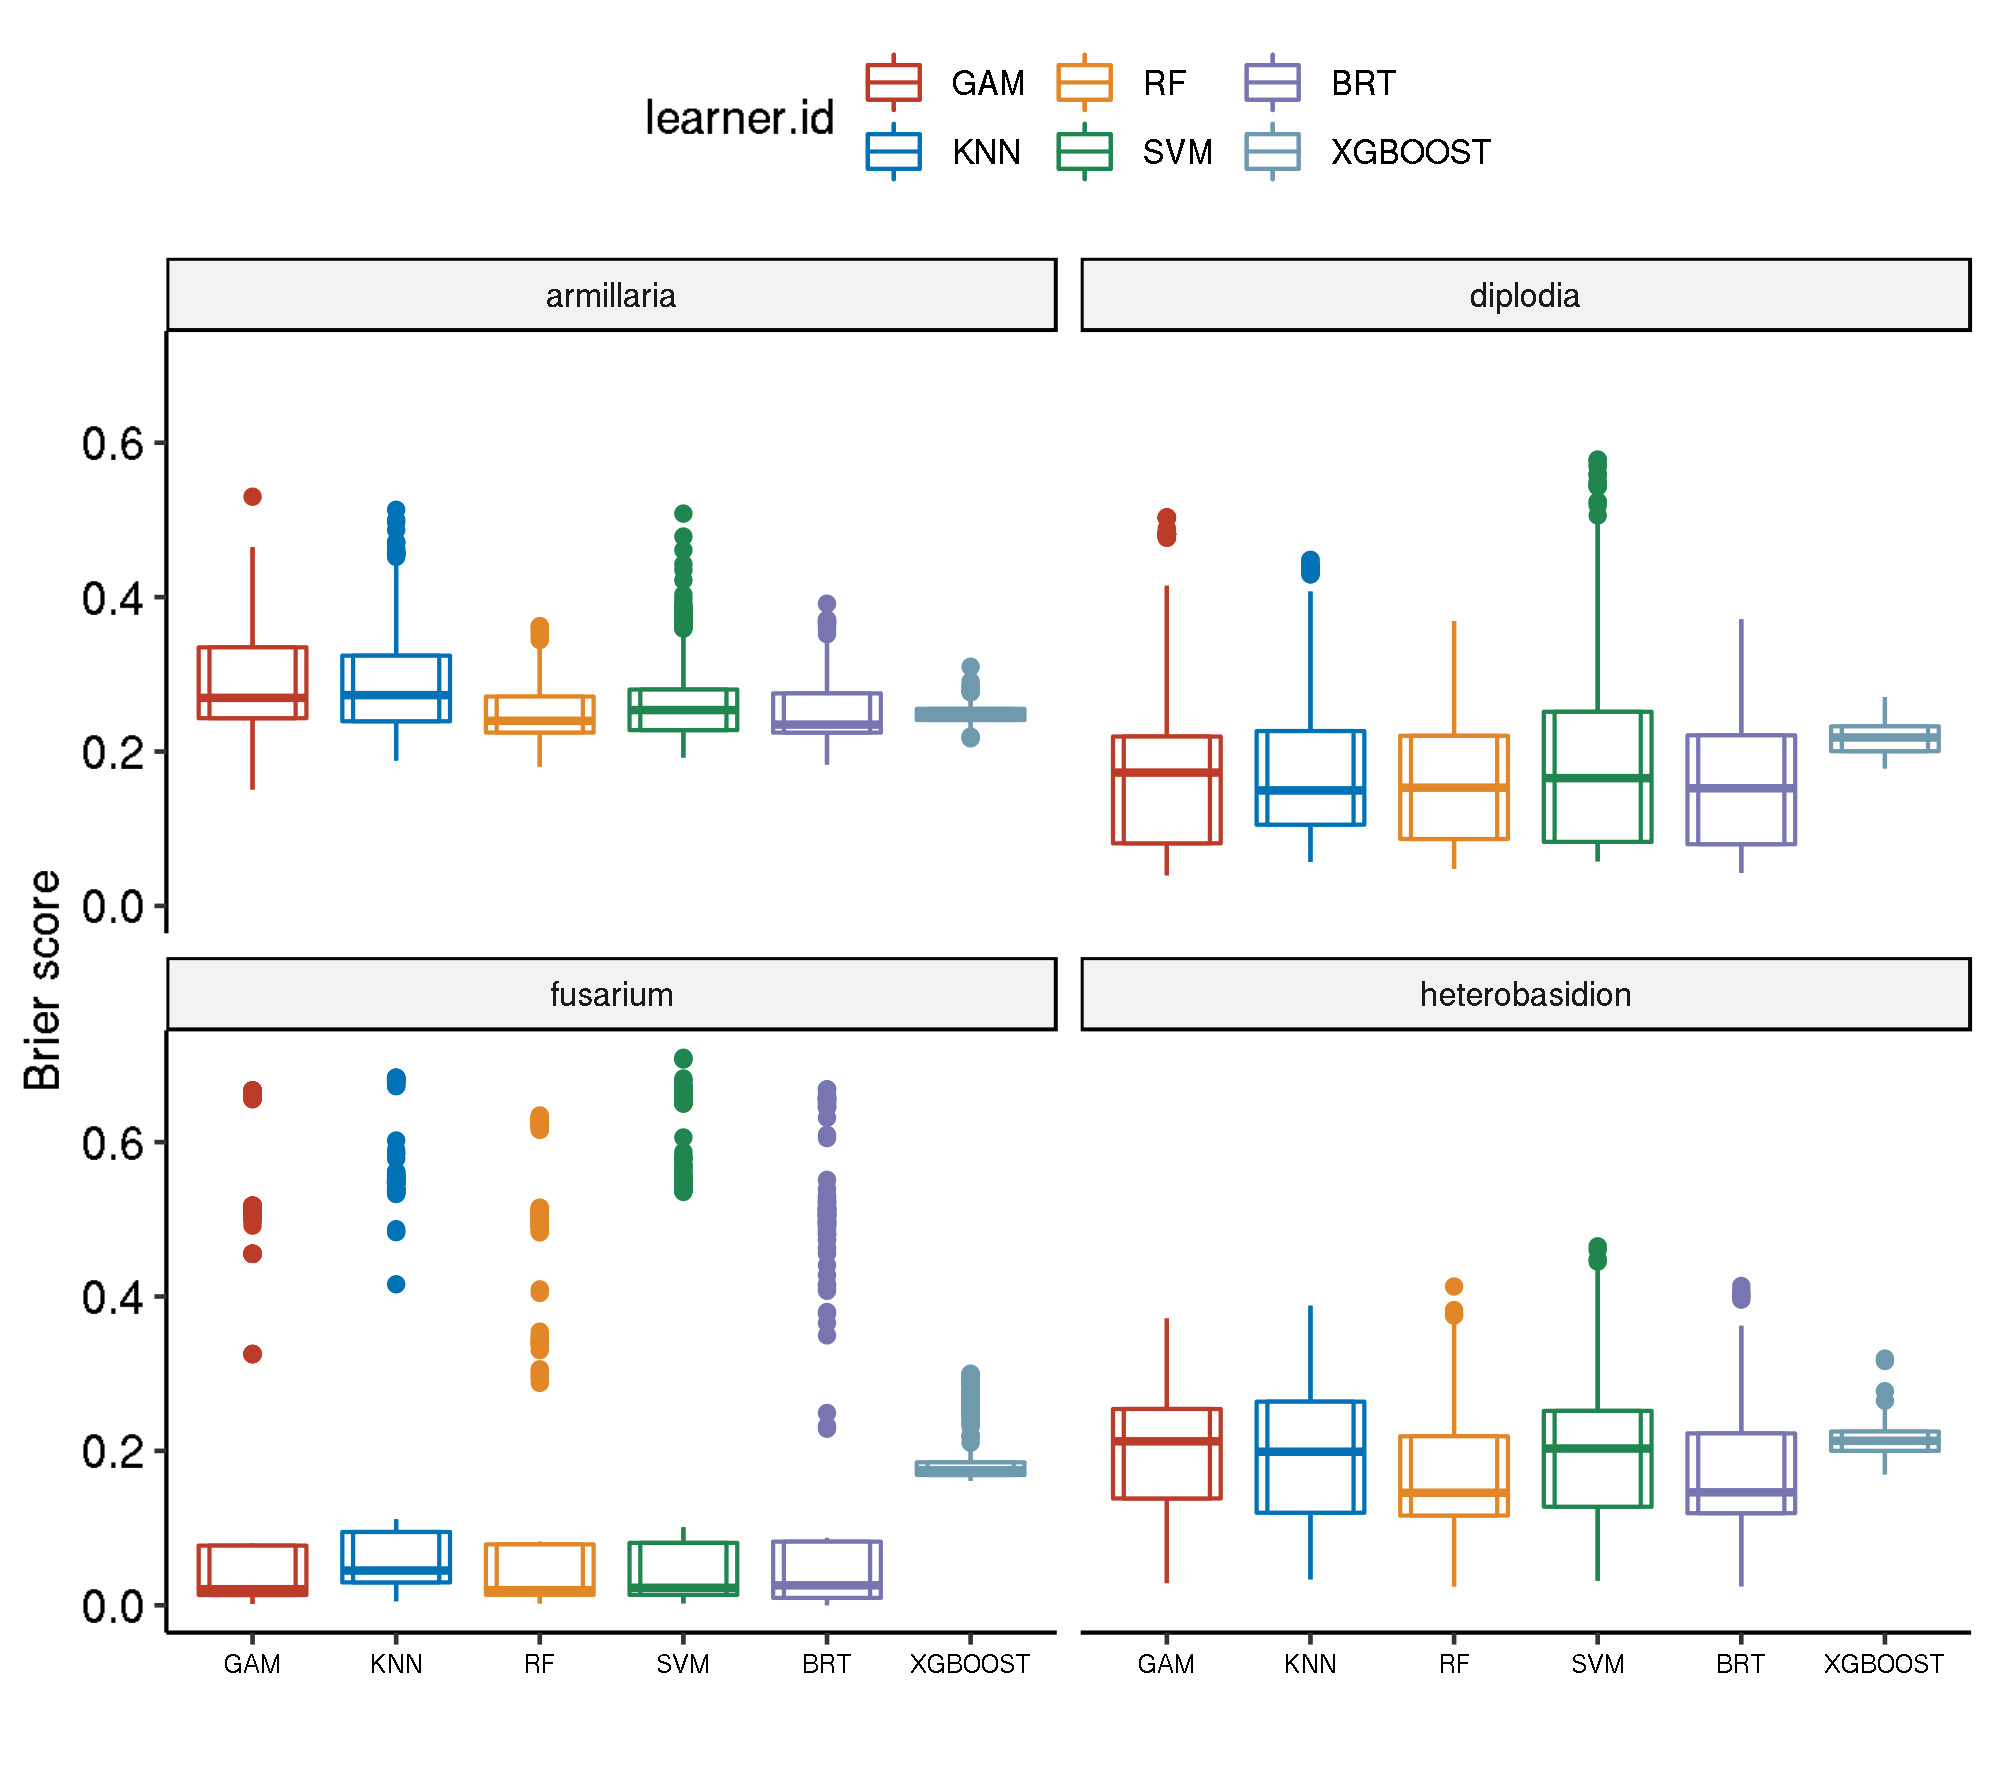
The structure of the following results presentation is as follows:
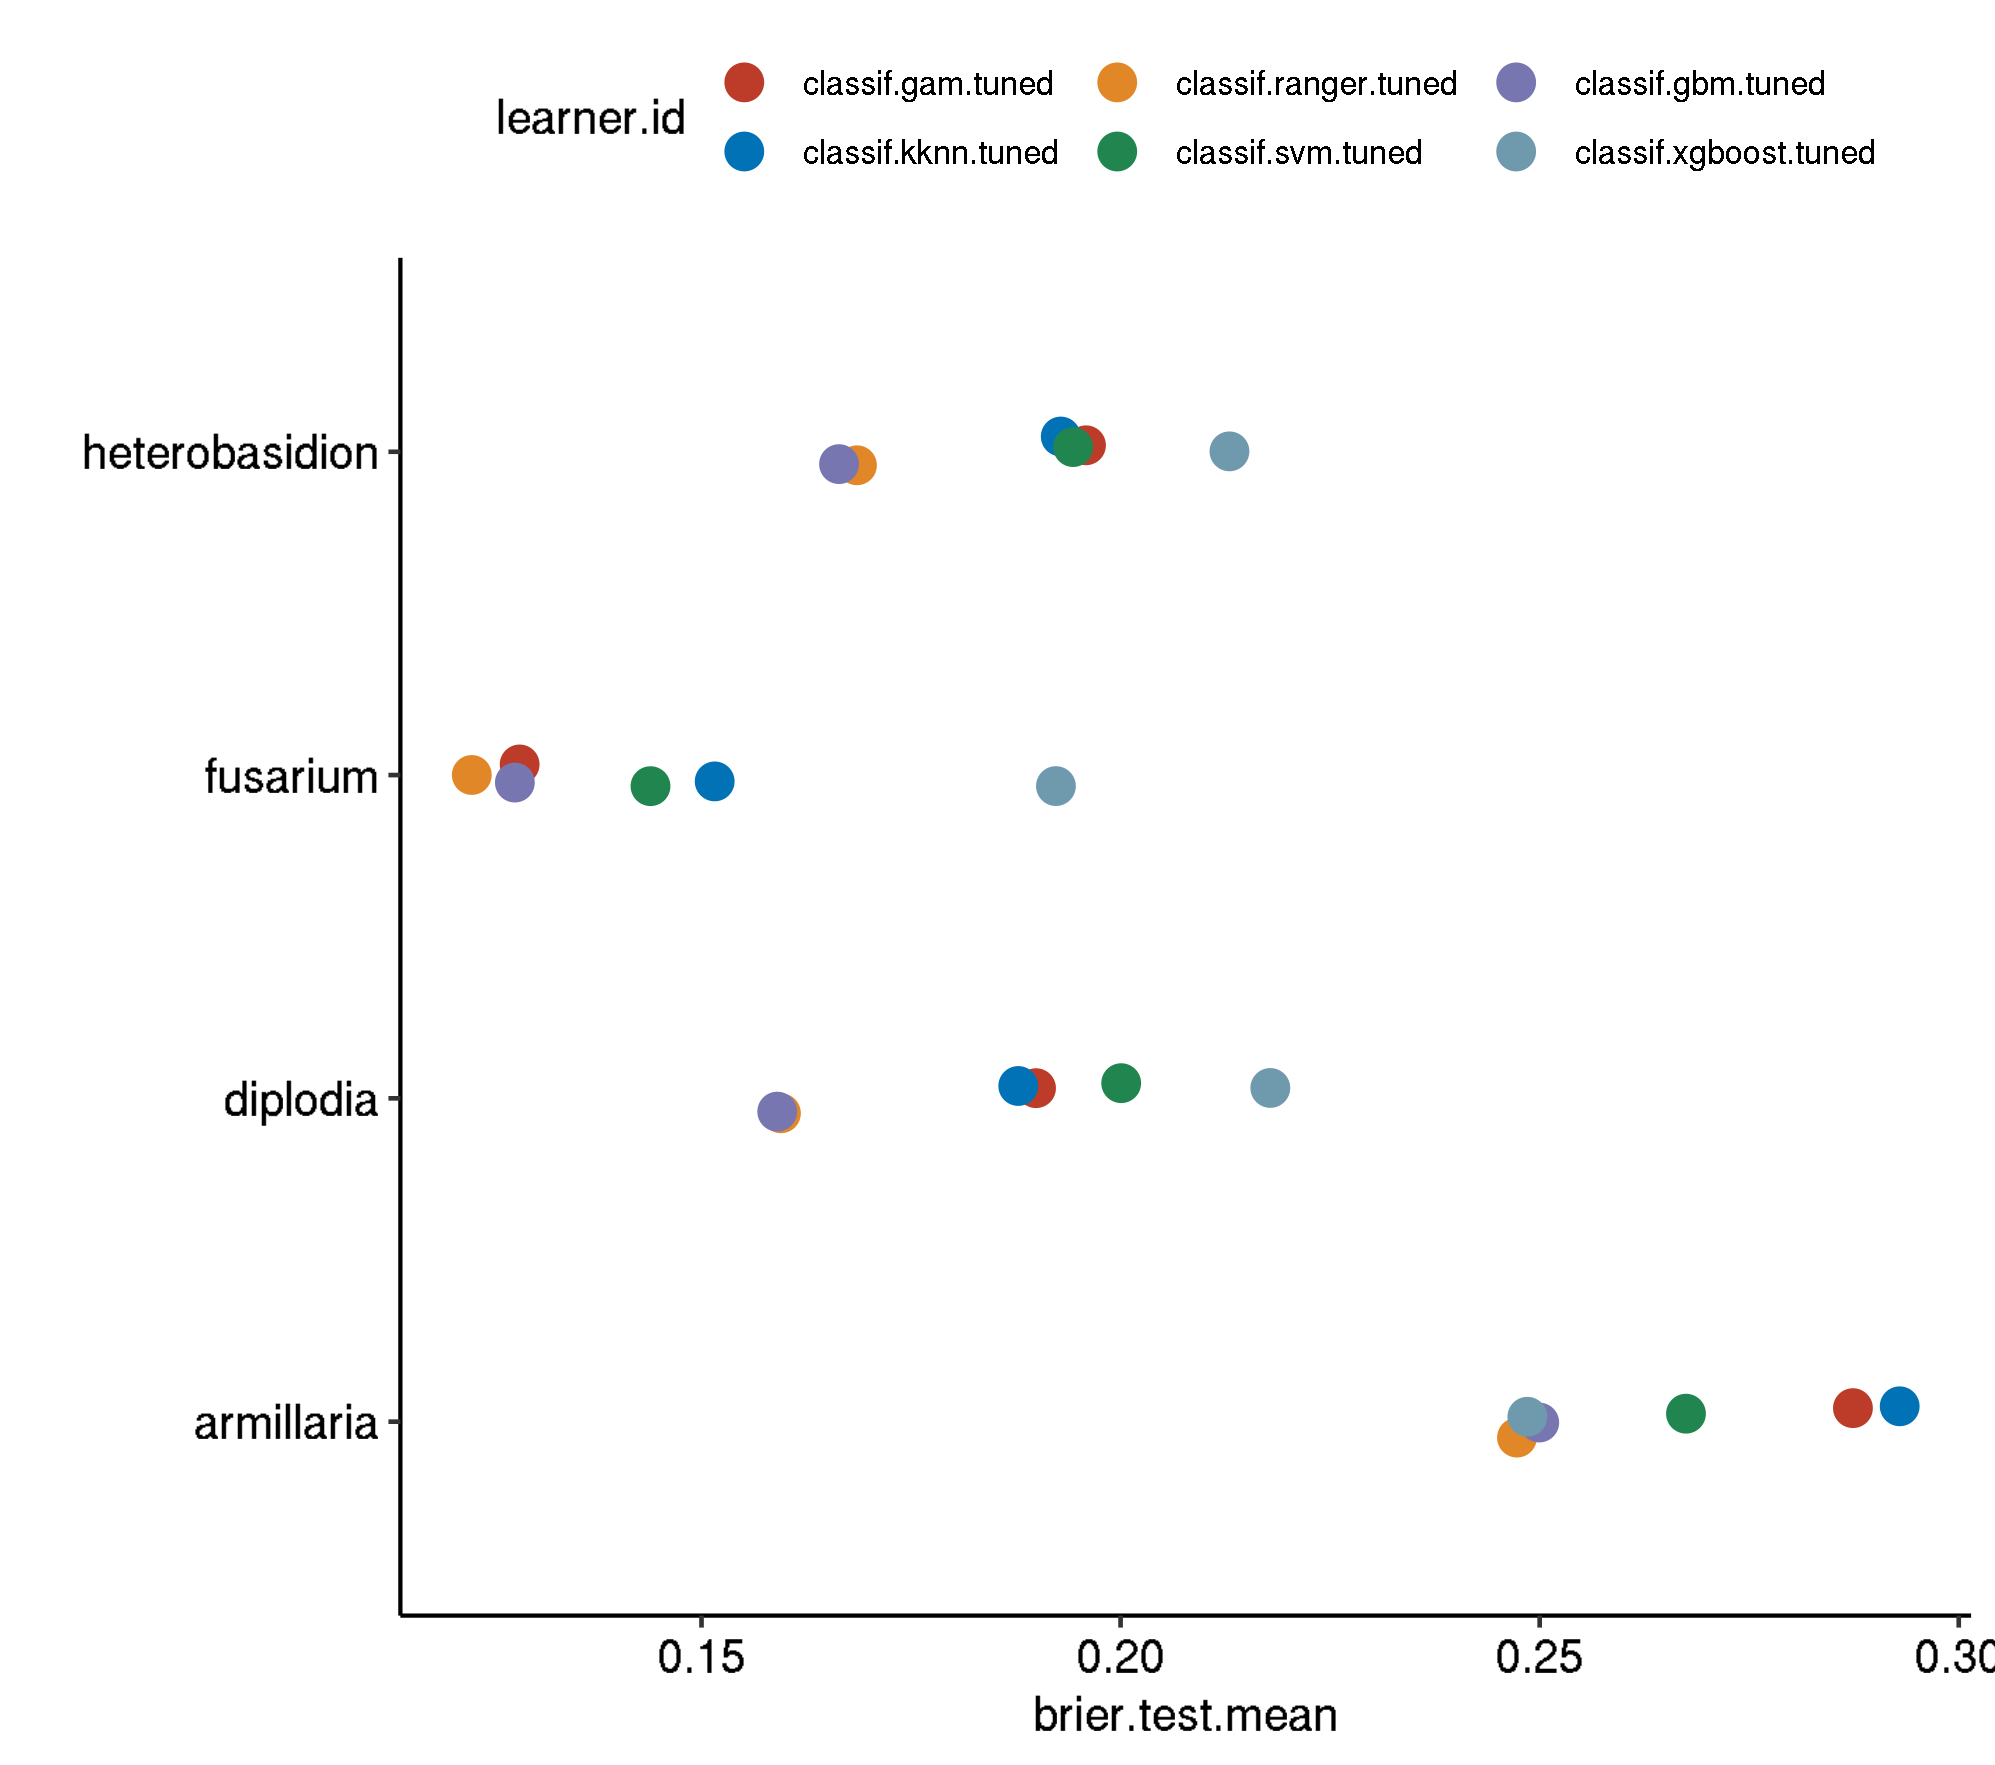
task.id learner.id brier.test.mean
1 armillaria classif.kknn.tuned 0.2929540
2 armillaria classif.gam.tuned 0.2873762
3 armillaria classif.svm.tuned 0.2674570
4 armillaria classif.gbm.tuned 0.2499506
5 armillaria classif.xgboost.tuned 0.2485308
6 armillaria classif.ranger.tuned 0.2472924
7 diplodia classif.xgboost.tuned 0.2178637
8 diplodia classif.svm.tuned 0.2000721
9 diplodia classif.gam.tuned 0.1899124
10 diplodia classif.kknn.tuned 0.1877918
11 diplodia classif.ranger.tuned 0.1594762
12 diplodia classif.gbm.tuned 0.1590360
13 fusarium classif.xgboost.tuned 0.1922855
14 fusarium classif.kknn.tuned 0.1515723
15 fusarium classif.svm.tuned 0.1439149
16 fusarium classif.gam.tuned 0.1283013
17 fusarium classif.gbm.tuned 0.1277329
18 fusarium classif.ranger.tuned 0.1225918
19 heterobasidion classif.xgboost.tuned 0.2129888
20 heterobasidion classif.gam.tuned 0.1958724
21 heterobasidion classif.svm.tuned 0.1943352
22 heterobasidion classif.kknn.tuned 0.1928612
23 heterobasidion classif.ranger.tuned 0.1685481
24 heterobasidion classif.gbm.tuned 0.1664094
timetrain.test.mean
1 115.6956
2 253.3654
3 303.2256
4 1538.8172
5 969.9928
6 353.9625
7 980.5603
8 194.6988
9 230.0244
10 109.7034
11 240.8807
12 1820.5990
13 814.4897
14 119.0948
15 202.8788
16 301.8513
17 2711.5960
18 265.6483
19 909.4810
20 264.7740
21 272.2715
22 117.6447
23 285.5910
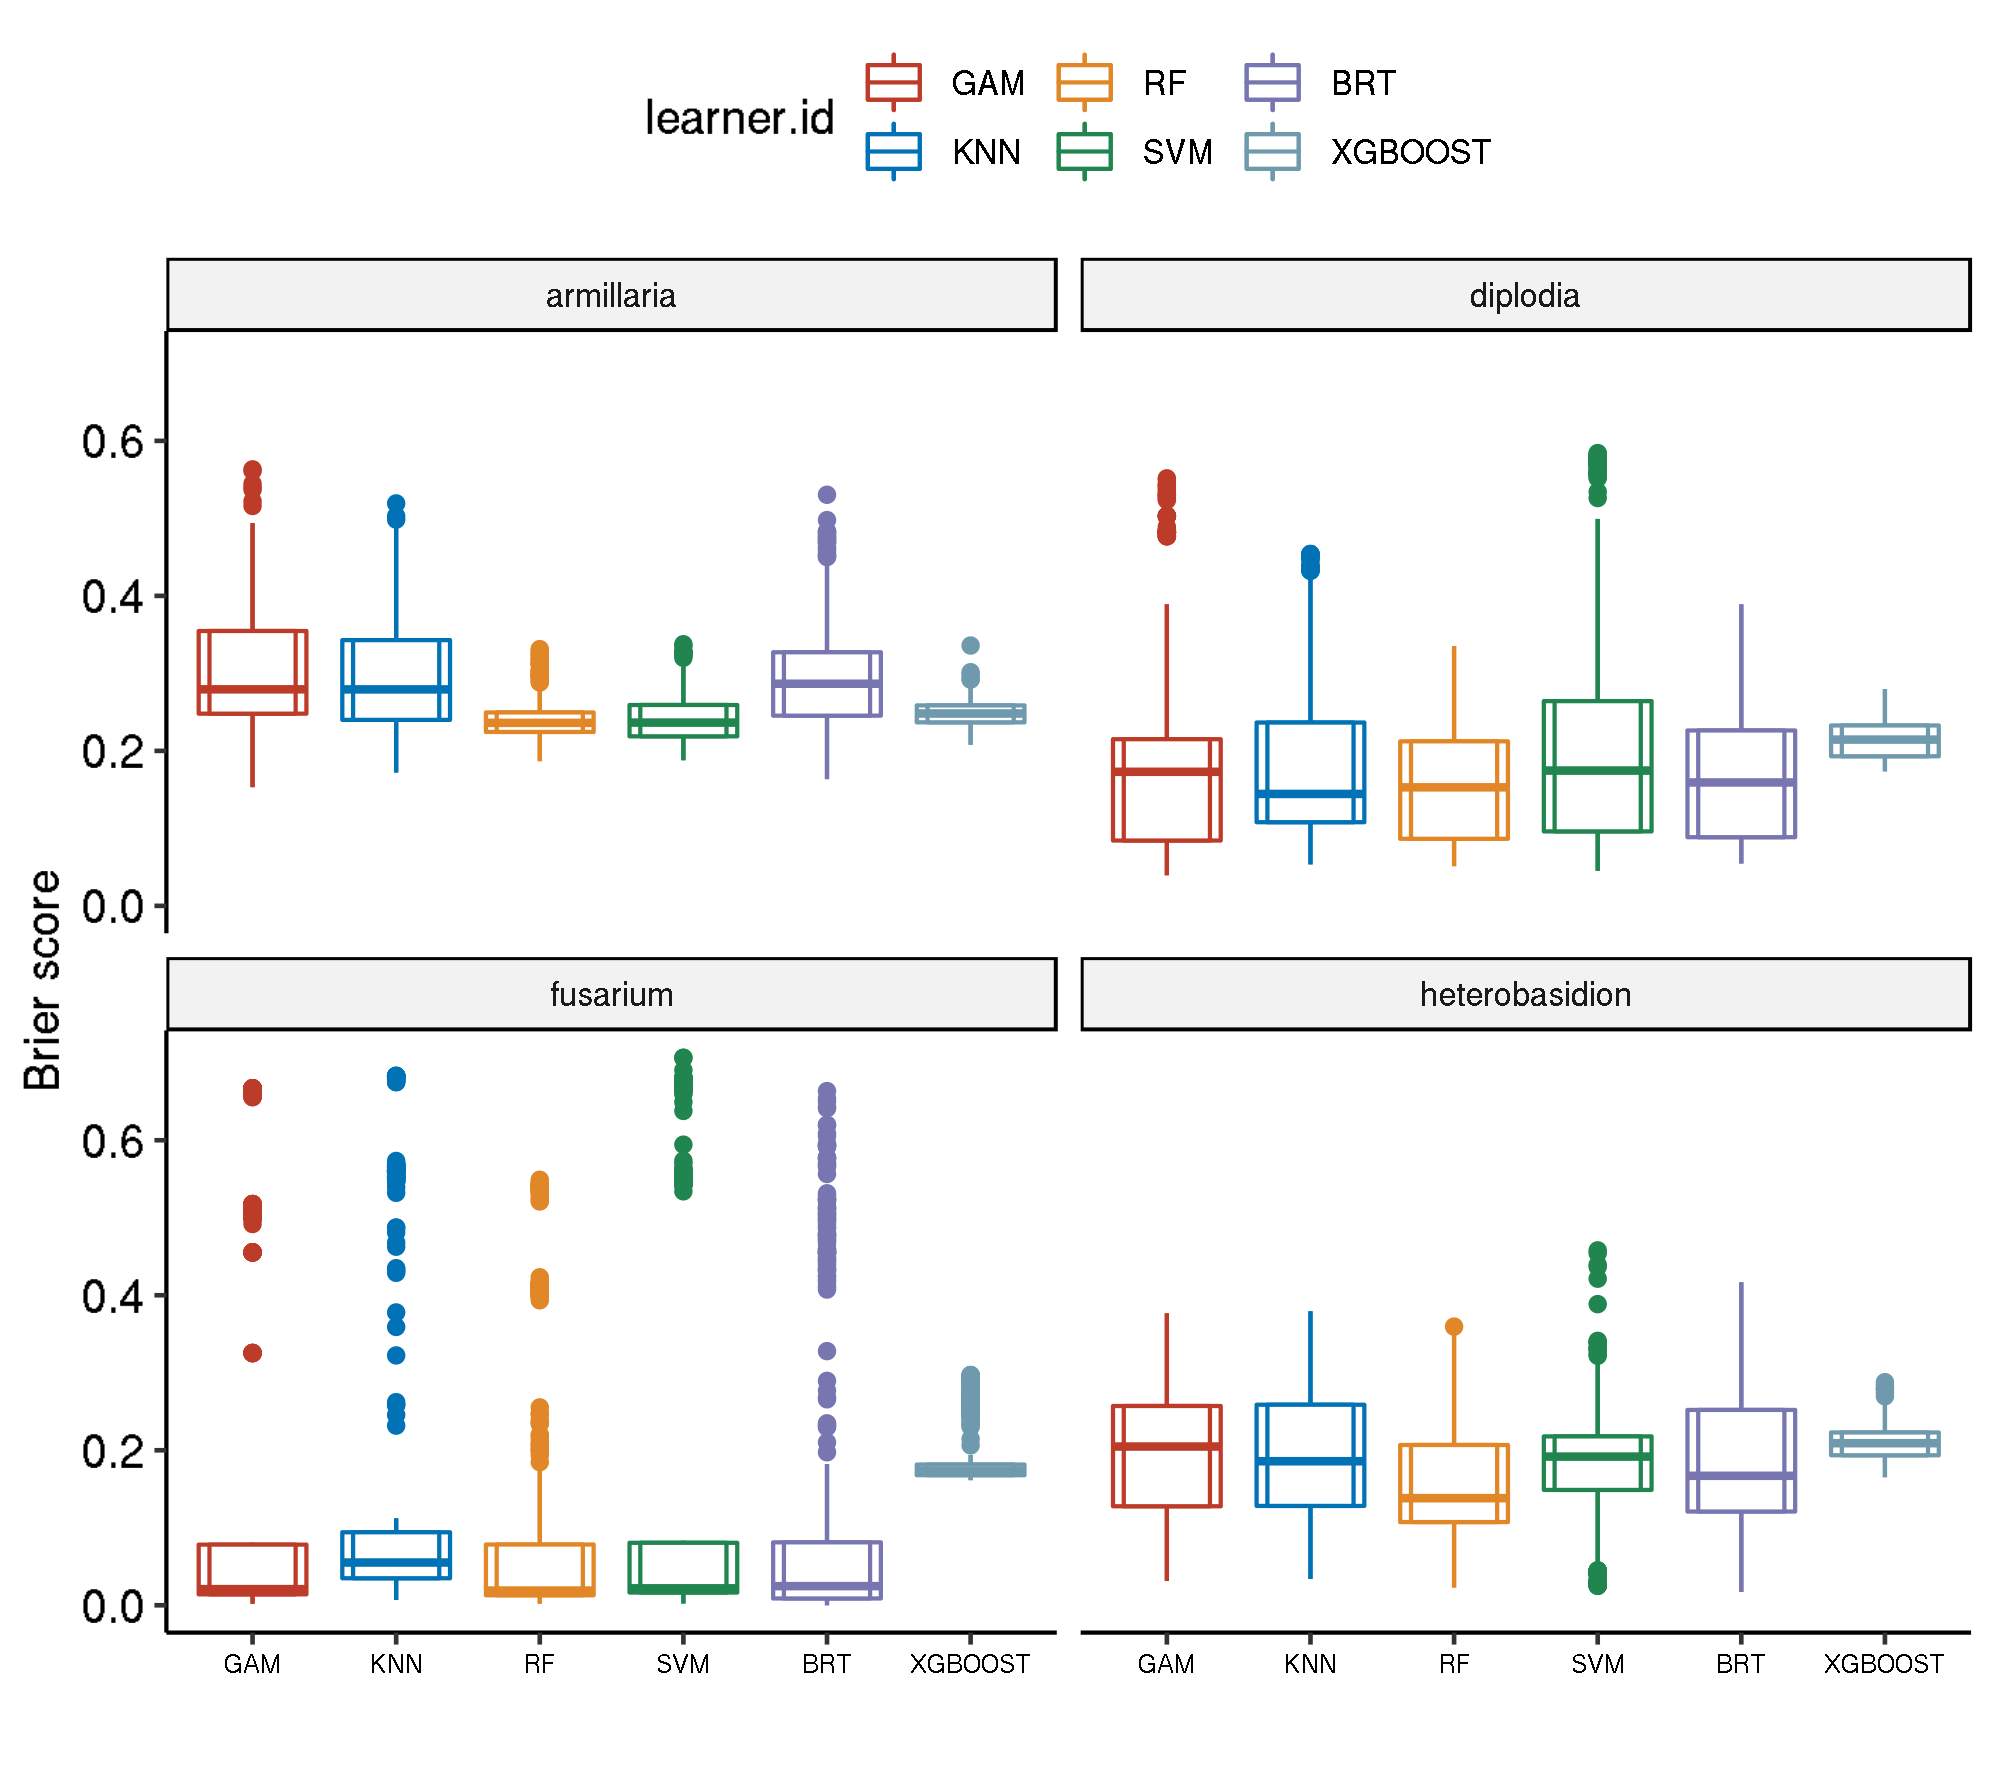
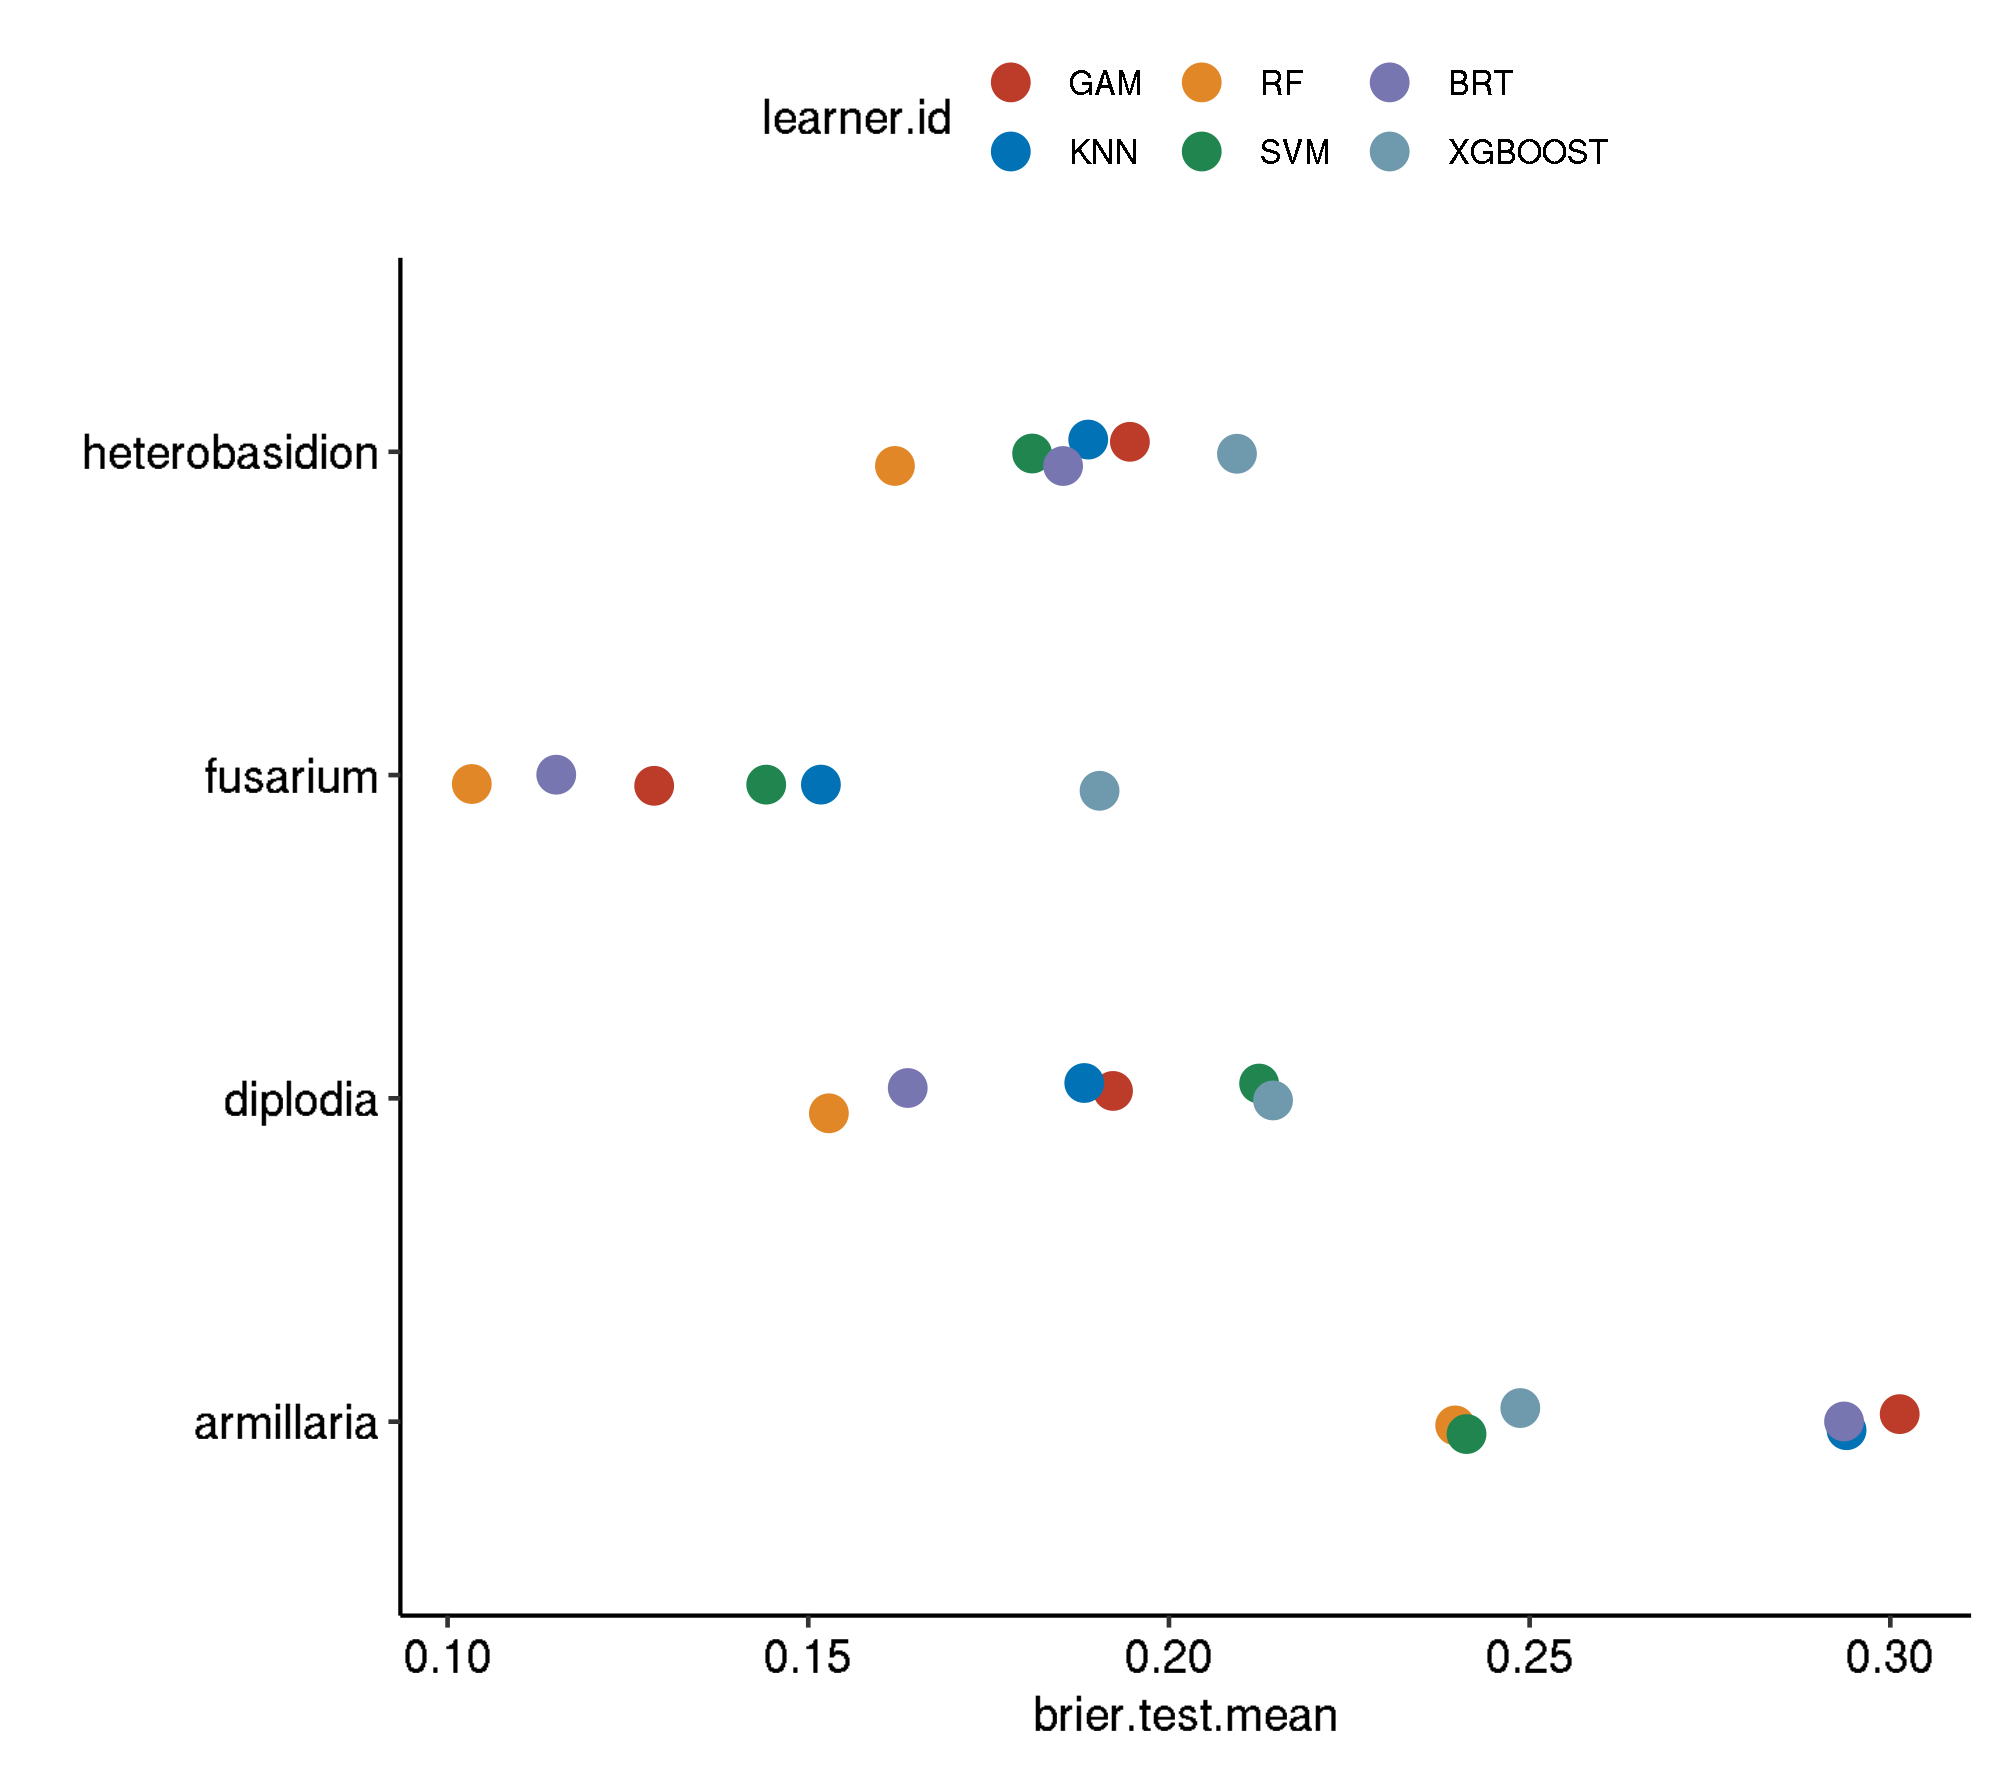
24 1942.1879 task.id learner.id brier.test.mean
1 armillaria classif.gam.tuned 0.3013001
2 armillaria classif.kknn.tuned 0.2939335
3 armillaria classif.gbm.tuned 0.2935869
4 armillaria classif.xgboost.tuned 0.2487059
5 armillaria classif.svm.tuned 0.2412515
6 armillaria classif.ranger.tuned 0.2396800
7 diplodia classif.xgboost.tuned 0.2144304
8 diplodia classif.svm.tuned 0.2125015
9 diplodia classif.gam.tuned 0.1922458
10 diplodia classif.kknn.tuned 0.1882630
11 diplodia classif.gbm.tuned 0.1637896
12 diplodia classif.ranger.tuned 0.1528584
13 fusarium classif.xgboost.tuned 0.1903816
14 fusarium classif.kknn.tuned 0.1517528
15 fusarium classif.svm.tuned 0.1441707
16 fusarium classif.gam.tuned 0.1286404
17 fusarium classif.gbm.tuned 0.1150637
18 fusarium classif.ranger.tuned 0.1033548
19 heterobasidion classif.xgboost.tuned 0.2094289
20 heterobasidion classif.gam.tuned 0.1945875
21 heterobasidion classif.kknn.tuned 0.1888104
22 heterobasidion classif.gbm.tuned 0.1853278
23 heterobasidion classif.svm.tuned 0.1810352
24 heterobasidion classif.ranger.tuned 0.1620154
timetrain.test.mean
1 251.5898
2 116.7439
3 2586.9143
4 1203.0043
5 307.8218
6 467.1088
7 1130.0532
8 389.3593
9 294.0095
10 121.3932
11 2095.5327
12 445.1206
13 840.9277
14 121.1683
15 221.6203
16 304.9121
17 2838.8523
18 309.1905
19 1013.3030
20 264.6495
21 117.8883
22 3010.3889
23 280.5194
24 383.2899 task.id learner.id brier.test.mean
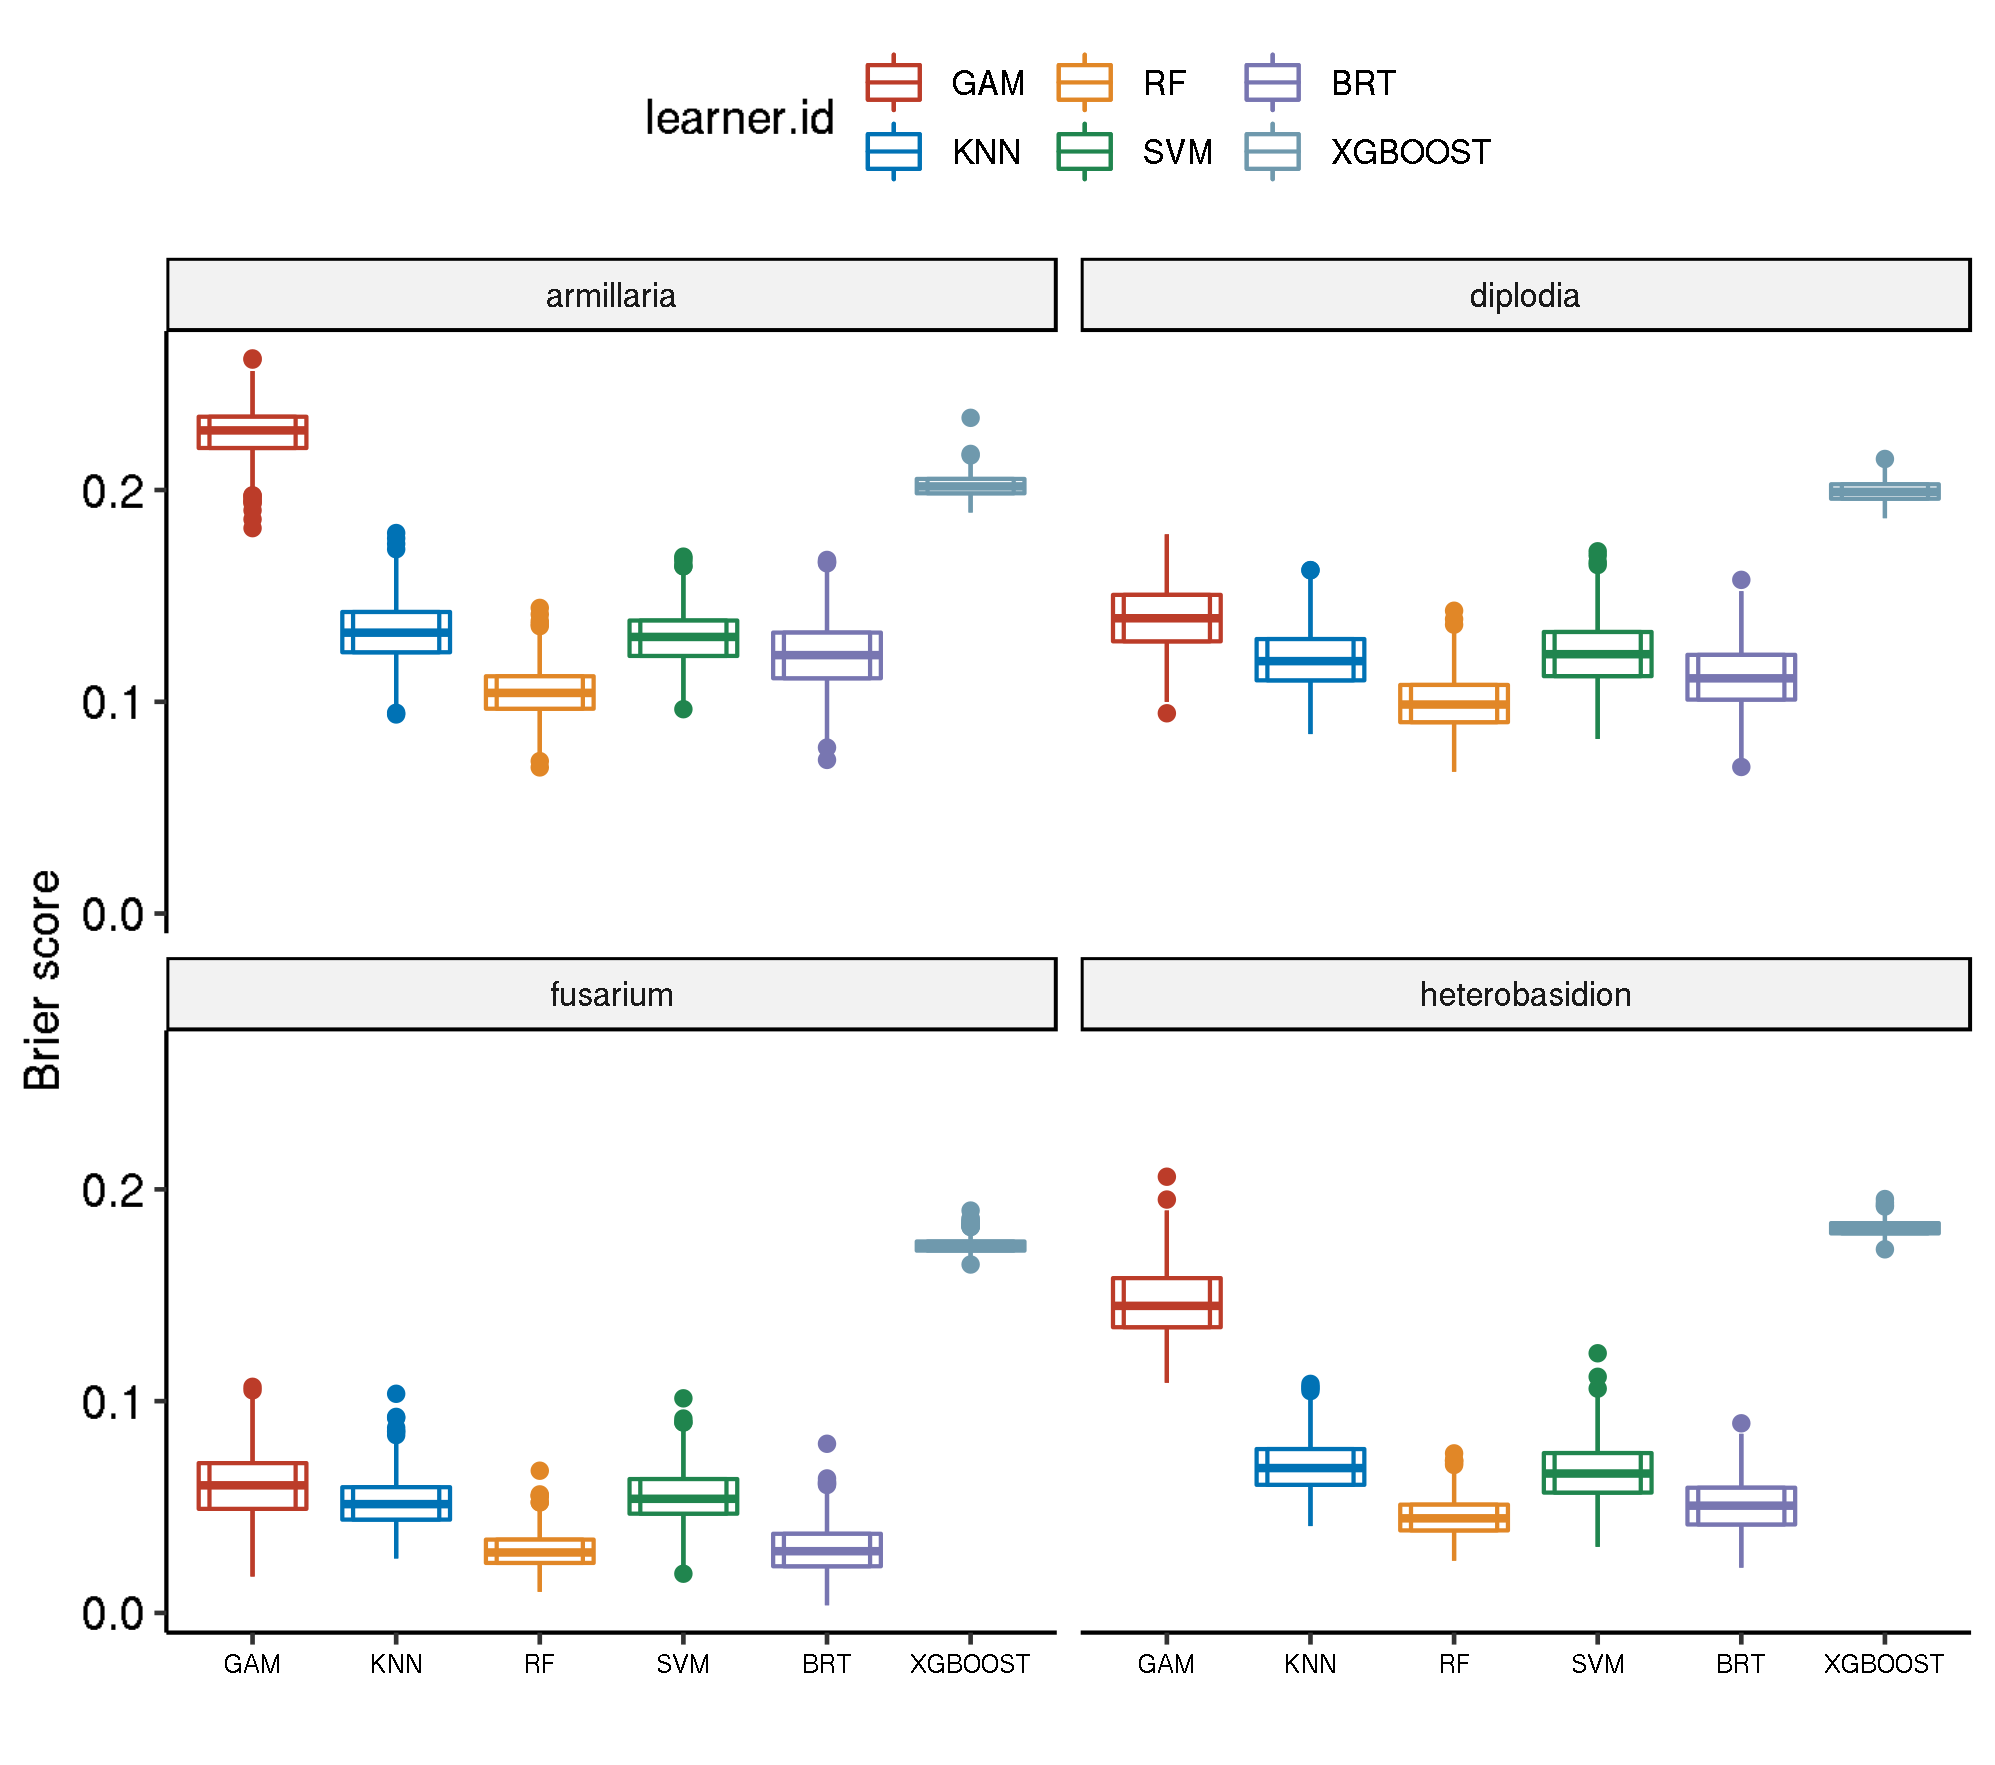
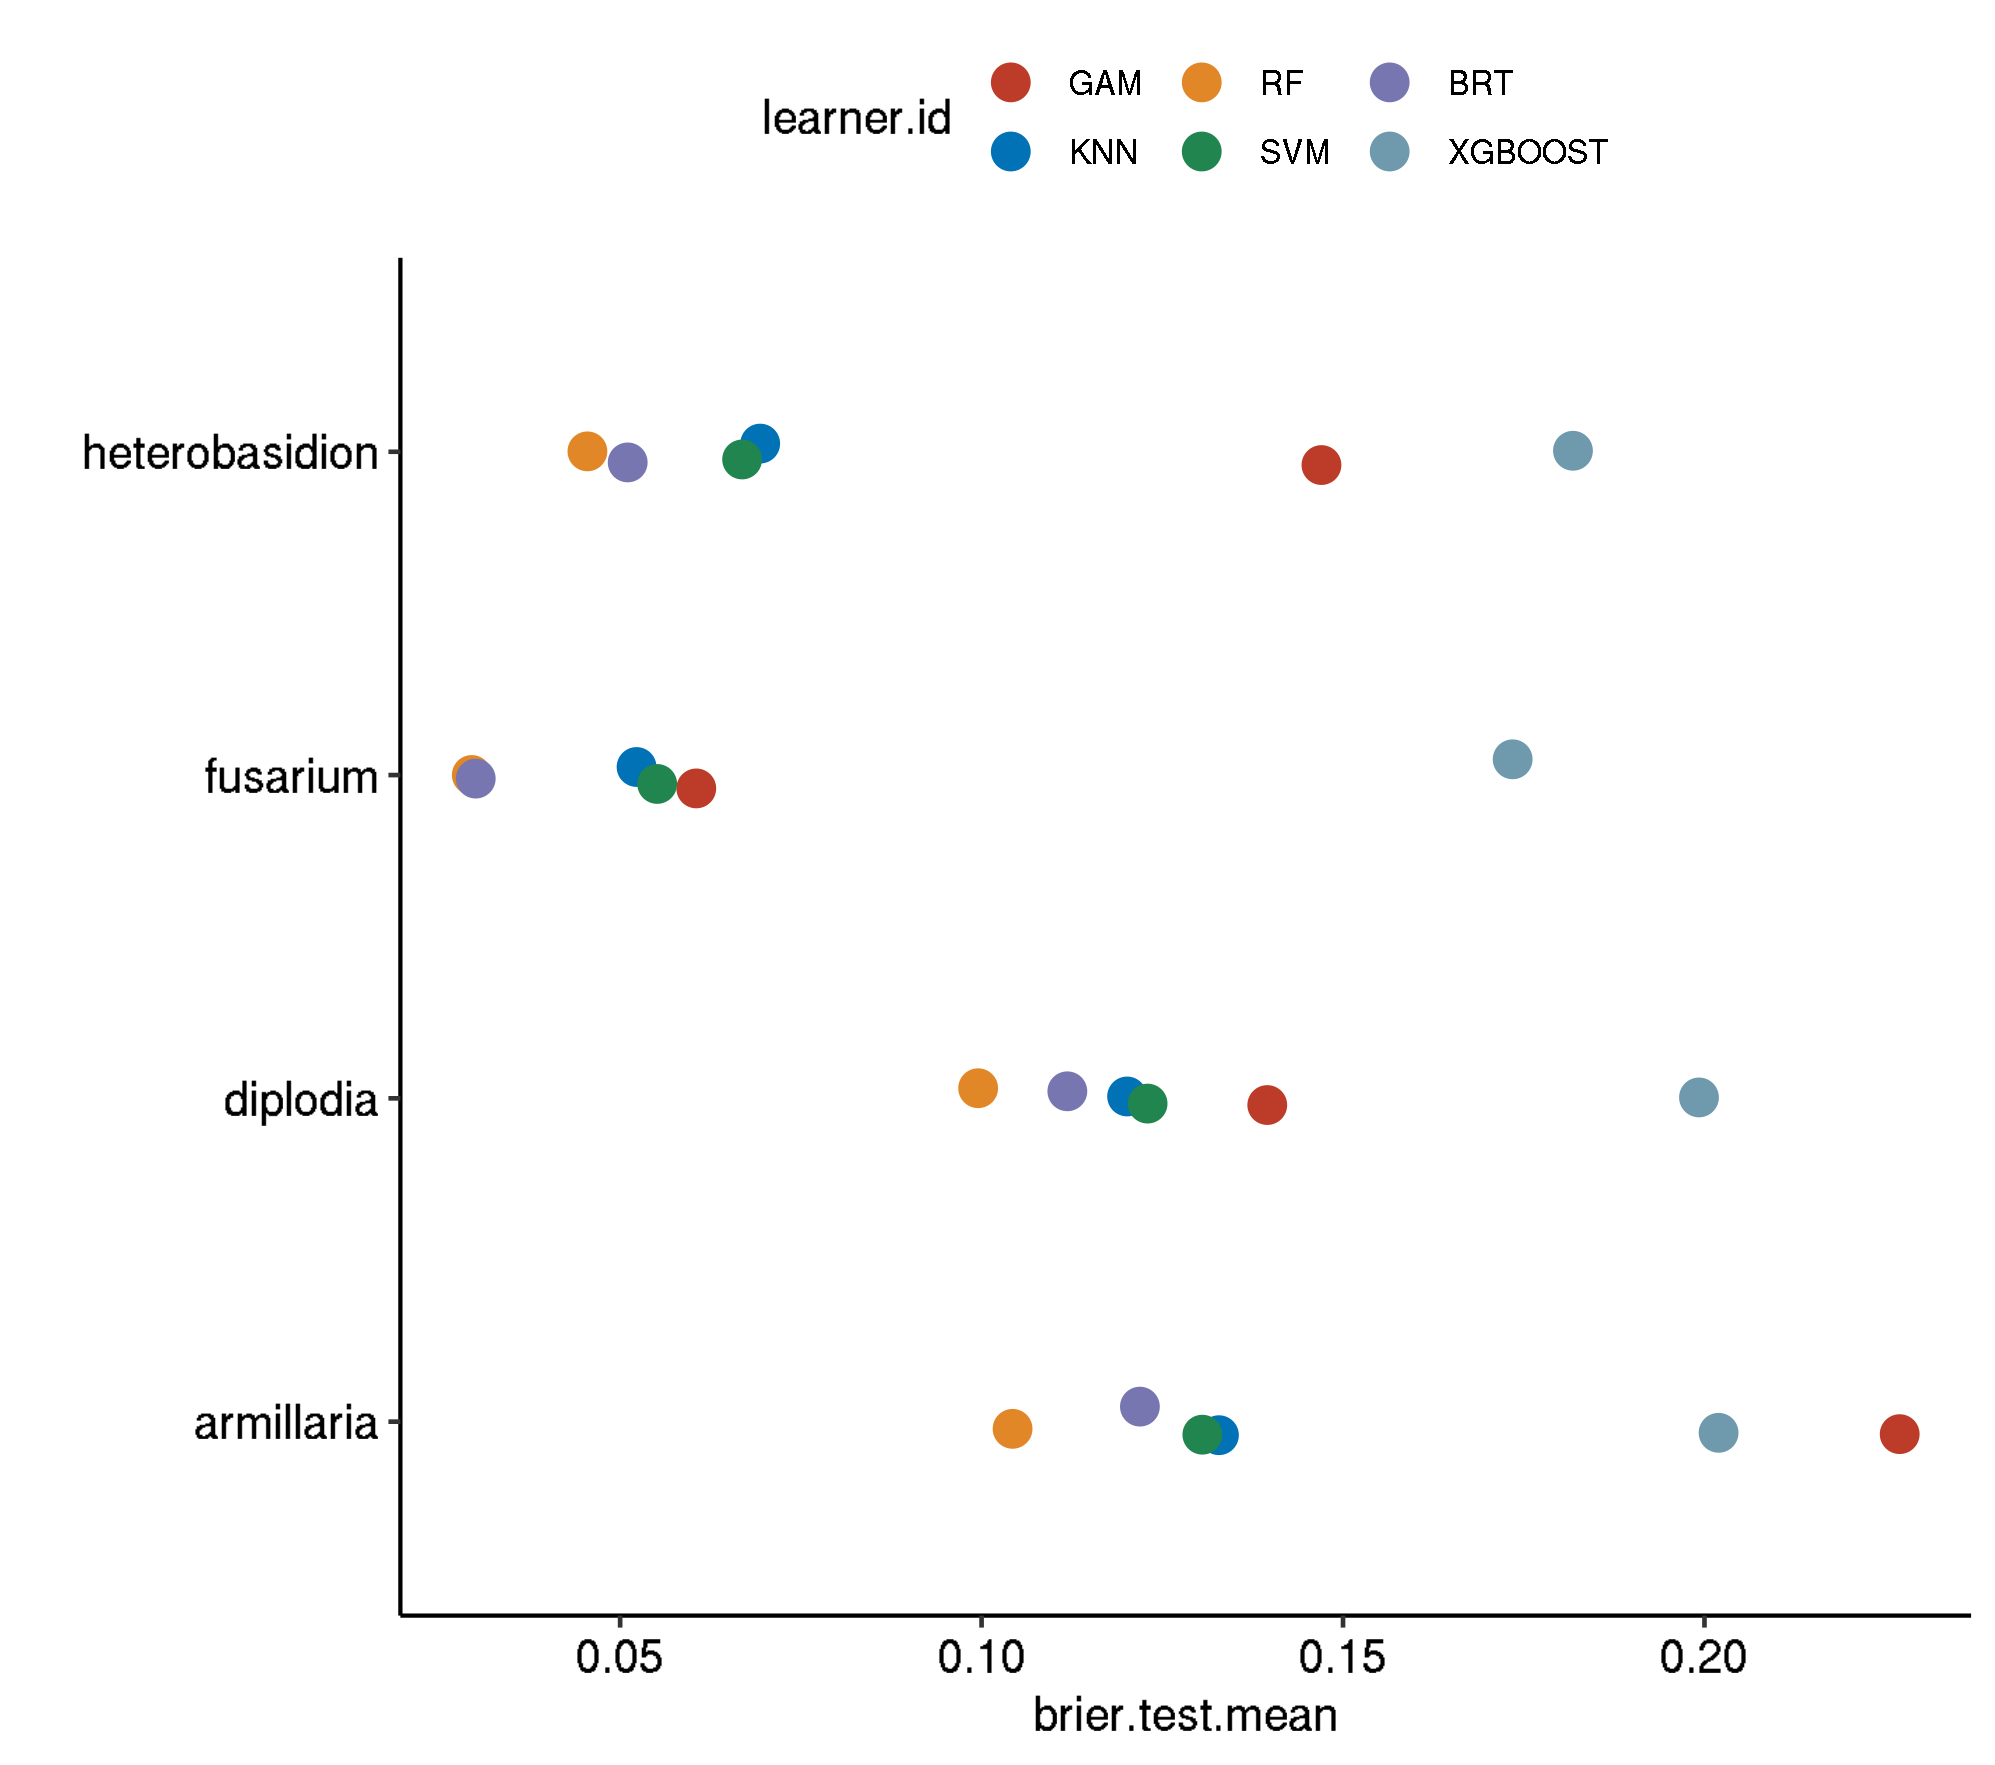
1 armillaria classif.gam.tuned 0.22700637
2 armillaria classif.xgboost.tuned 0.20195496
3 armillaria classif.kknn.tuned 0.13283583
4 armillaria classif.svm.tuned 0.13054167
5 armillaria classif.gbm.tuned 0.12190209
6 armillaria classif.ranger.tuned 0.10428849
7 diplodia classif.xgboost.tuned 0.19924264
8 diplodia classif.gam.tuned 0.13952038
9 diplodia classif.svm.tuned 0.12296446
10 diplodia classif.kknn.tuned 0.12013106
11 diplodia classif.gbm.tuned 0.11186382
12 diplodia classif.ranger.tuned 0.09952600
13 fusarium classif.xgboost.tuned 0.17346649
14 fusarium classif.gam.tuned 0.06053425
15 fusarium classif.svm.tuned 0.05512555
16 fusarium classif.kknn.tuned 0.05227486
17 fusarium classif.gbm.tuned 0.03002464
18 fusarium classif.ranger.tuned 0.02947792
19 heterobasidion classif.xgboost.tuned 0.18180963
20 heterobasidion classif.gam.tuned 0.14701701
21 heterobasidion classif.kknn.tuned 0.06937628
22 heterobasidion classif.svm.tuned 0.06687576
23 heterobasidion classif.gbm.tuned 0.05104793
24 heterobasidion classif.ranger.tuned 0.04547533
timetrain.test.mean
1 250.7466
2 1218.4911
3 116.8461
4 306.5662
5 2569.8308
6 477.9465
7 1149.5982
8 290.8944
9 406.3464
10 121.3484
11 1999.3005
12 440.4030
13 868.2870
14 288.3264
15 202.4960
16 120.7944
17 2786.2014
18 319.6525
19 1027.6968
20 269.1685
21 116.9535
22 290.4438
23 3021.3505
24 391.0410 task.id learner.id brier.test.mean timetrain.test.mean
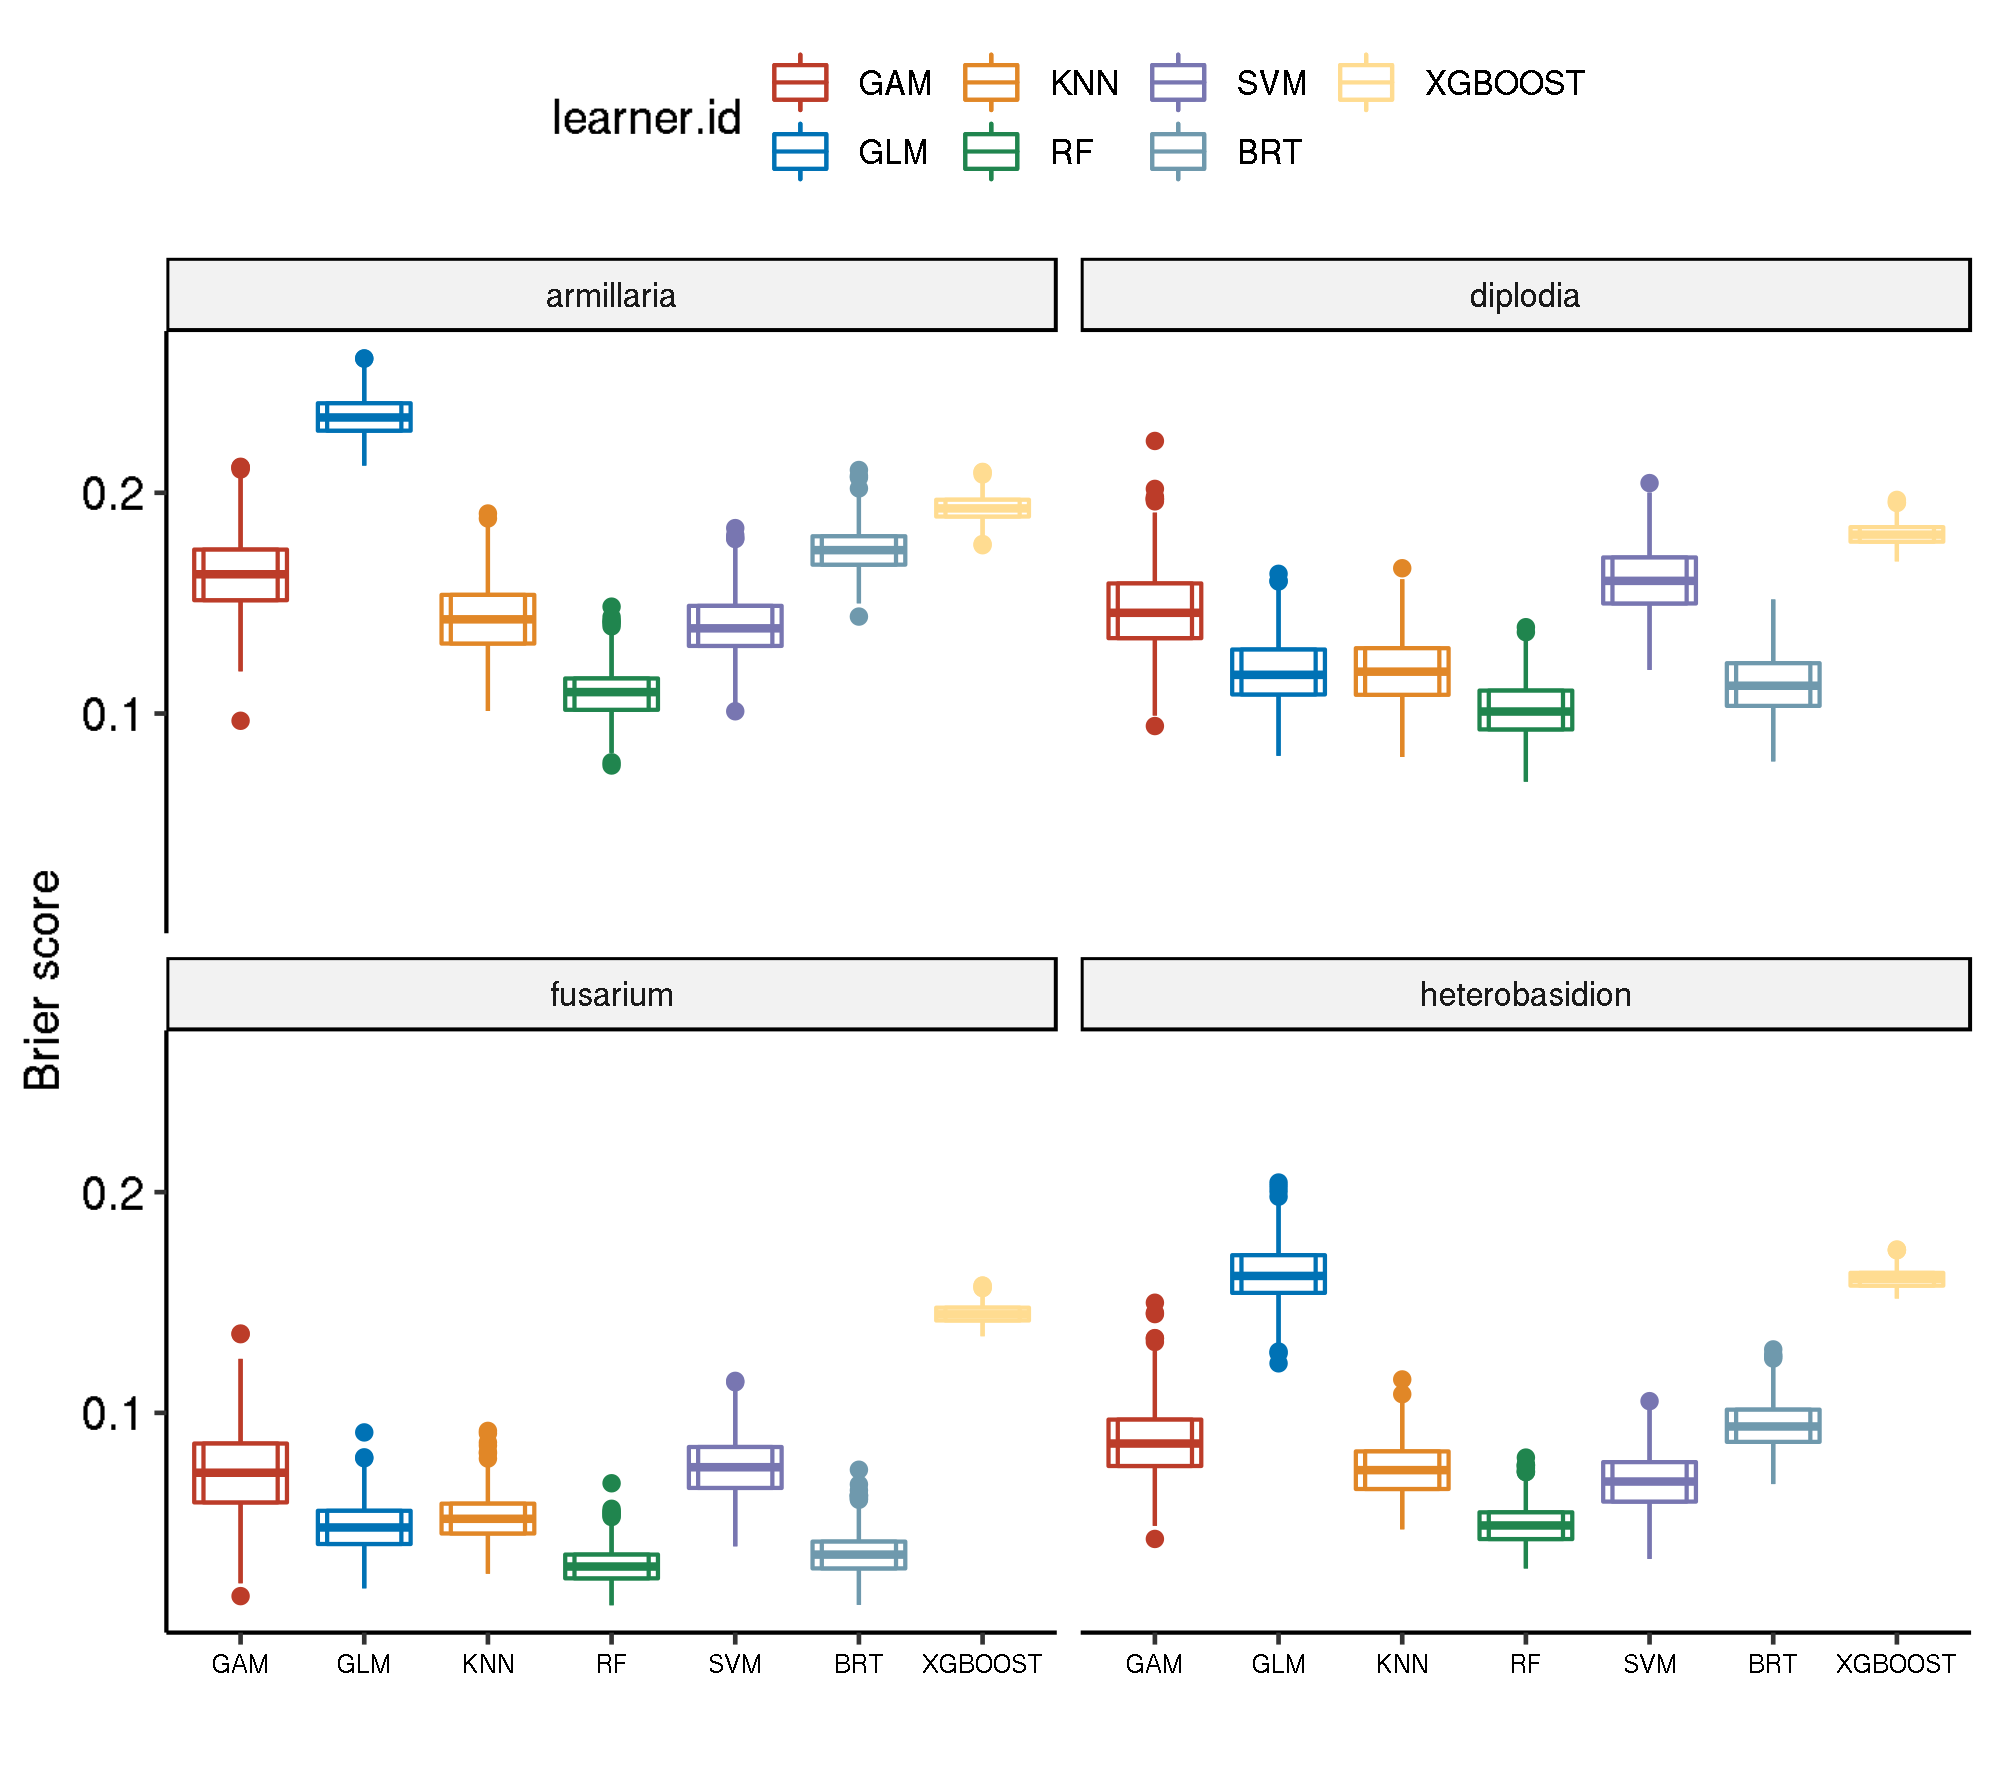
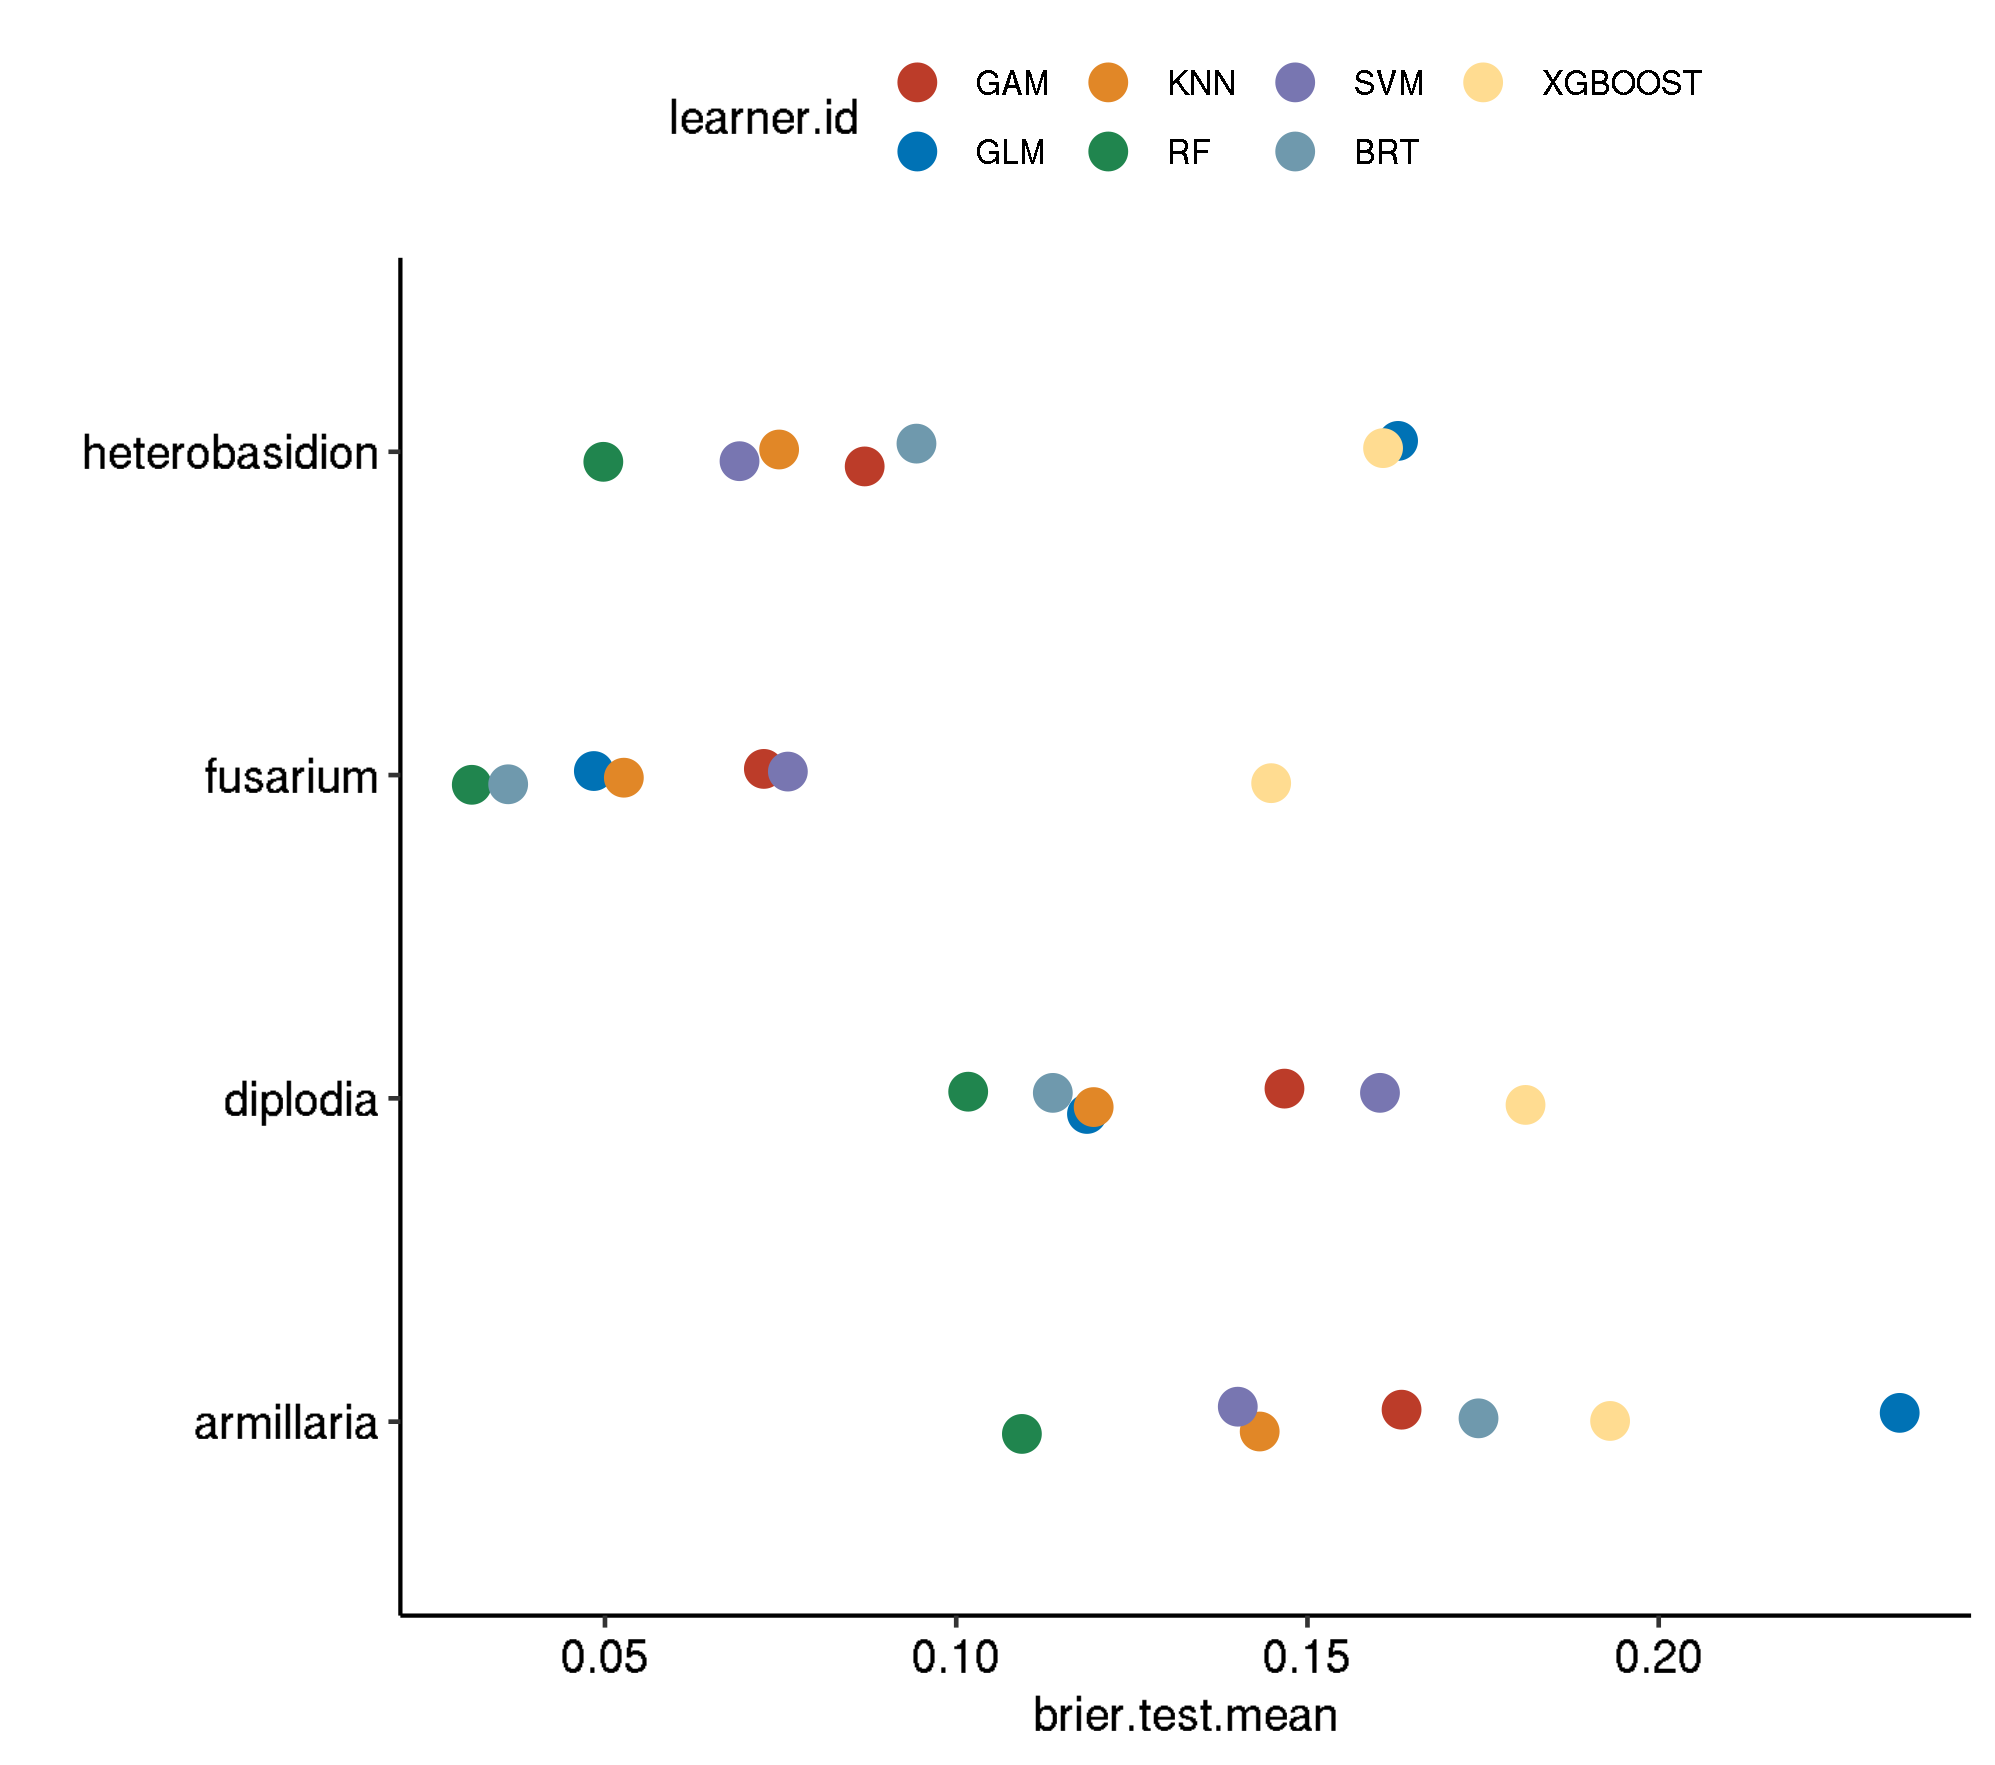
1 armillaria classif.binomial 0.23430477 0.019098
2 armillaria classif.xgboost 0.19308152 0.588122
3 armillaria classif.gbm 0.17435081 0.047364
4 armillaria classif.gam 0.16339620 0.234416
5 armillaria classif.kknn 0.14319871 0.000534
6 armillaria classif.svm 0.14008004 0.207078
7 armillaria classif.ranger 0.10934871 0.357818
8 diplodia classif.xgboost 0.18104208 1.016850
9 diplodia classif.svm 0.16032300 0.638496
10 diplodia classif.gam 0.14672641 0.615932
11 diplodia classif.kknn 0.11956687 0.000772
12 diplodia classif.binomial 0.11861260 0.021954
13 diplodia classif.gbm 0.11375122 0.060954
14 diplodia classif.ranger 0.10170460 0.667556
15 fusarium classif.xgboost 0.14483346 0.186976
16 fusarium classif.svm 0.07603583 0.241892
17 fusarium classif.gam 0.07261828 0.363594
18 fusarium classif.kknn 0.05268736 0.000528
19 fusarium classif.binomial 0.04841708 0.027582
20 fusarium classif.gbm 0.03622046 0.050656
21 fusarium classif.ranger 0.03103918 0.195660
22 heterobasidion classif.binomial 0.16290012 0.022228
23 heterobasidion classif.xgboost 0.16076201 0.210498
24 heterobasidion classif.gbm 0.09434126 0.045940
25 heterobasidion classif.gam 0.08696898 0.252826
26 heterobasidion classif.kknn 0.07479138 0.000570
27 heterobasidion classif.svm 0.06915348 0.181514
28 heterobasidion classif.ranger 0.04976475 0.249832 task.id learner.id brier.test.mean timetrain.test.mean
1 armillaria classif.gam 0.34203122 0.224132
2 armillaria classif.kknn 0.28773607 0.000632
3 armillaria classif.binomial 0.28400164 0.018868
4 armillaria classif.gbm 0.27648700 0.048196
5 armillaria classif.xgboost 0.25095005 0.612810
6 armillaria classif.svm 0.25076442 0.201892
7 armillaria classif.ranger 0.23791242 0.325748
8 diplodia classif.gam 0.25052534 0.569212
9 diplodia classif.svm 0.20094838 0.627202
10 diplodia classif.xgboost 0.19986164 1.025680
11 diplodia classif.binomial 0.17030072 0.022436
12 diplodia classif.kknn 0.16892370 0.001134
13 diplodia classif.gbm 0.15981173 0.062854
14 diplodia classif.ranger 0.14990091 0.651948
15 fusarium classif.xgboost 0.17056495 0.162042
16 fusarium classif.svm 0.15712093 0.230380
17 fusarium classif.gam 0.13216430 0.362944
18 fusarium classif.kknn 0.13069975 0.000566
19 fusarium classif.gbm 0.10680714 0.050994
20 fusarium classif.ranger 0.10410518 0.184228
21 fusarium classif.binomial 0.09171266 0.026594
22 heterobasidion classif.gam 0.25236362 0.287420
23 heterobasidion classif.binomial 0.19785015 0.022448
24 heterobasidion classif.xgboost 0.19305571 0.165192
25 heterobasidion classif.gbm 0.18311438 0.045782
26 heterobasidion classif.svm 0.18252532 0.175006
27 heterobasidion classif.kknn 0.17918672 0.000638
28 heterobasidion classif.ranger 0.16098088 0.236158Brenning, A. 2012. “Spatial Cross-Validation and Bootstrap for the Assessment of Prediction Rules in Remote Sensing: The R Package Sperrorest.” In 2012 Ieee International Geoscience and Remote Sensing Symposium, 5372–5. https://doi.org/10.1109/IGARSS.2012.6352393.
R version 3.5.1 (2018-07-02)
Platform: x86_64-pc-linux-gnu (64-bit)
Running under: CentOS Linux 7 (Core)

Matrix products: default
BLAS: /opt/spack/opt/spack/linux-centos7-x86_64/gcc-7.3.0/r-3.5.1-b4xhm3pook4yl4olk6ttnovnyttdpkhe/rlib/R/lib/libRblas.so
LAPACK: /opt/spack/opt/spack/linux-centos7-x86_64/gcc-7.3.0/r-3.5.1-b4xhm3pook4yl4olk6ttnovnyttdpkhe/rlib/R/lib/libRlapack.so

locale:
 [1] LC_CTYPE=en_GB.UTF-8       LC_NUMERIC=C
 [3] LC_TIME=en_GB.UTF-8        LC_COLLATE=en_GB.UTF-8
 [5] LC_MONETARY=en_GB.UTF-8    LC_MESSAGES=en_GB.UTF-8
 [7] LC_PAPER=en_GB.UTF-8       LC_NAME=C
 [9] LC_ADDRESS=C               LC_TELEPHONE=C
[11] LC_MEASUREMENT=en_GB.UTF-8 LC_IDENTIFICATION=C

attached base packages:
[1] stats     graphics  grDevices utils     datasets  methods   base

other attached packages:
 [1] tidyselect_0.2.5    workflowr_1.3.0     here_0.1
 [4] kableExtra_1.1.0    ggExtra_0.8         ggrepel_0.8.0
 [7] reporttools_1.1.2   xtable_1.8-3        cowplot_0.9.3
[10] hrbrthemes_0.6.0    ggpubr_0.2          future.callr_0.4.0
[13] furrr_0.1.0.9002    future_1.11.1.1     ggsci_2.9
[16] clustermq_0.8.6     ggspatial_1.0.3     ggplot2_3.0.0
[19] rgenoud_5.8-3.0     fs_1.2.6            curl_3.2
[22] R.utils_2.7.0       R.oo_1.22.0         R.methodsS3_1.7.1
[25] GSIF_0.5-5          stringr_1.3.1       RSAGA_1.3.0
[28] plyr_1.8.4          shapefiles_0.7      foreign_0.8-71
[31] gstat_1.1-6         glue_1.3.0          rasterVis_0.45
[34] latticeExtra_0.6-28 RColorBrewer_1.1-2  lattice_0.20-35
[37] raster_2.8-19       viridis_0.5.1       viridisLite_0.3.0
[40] rgdal_1.4-3         sp_1.3-1            tibble_2.0.1
[43] forcats_0.3.0       lwgeom_0.1-6        dplyr_0.8.0.1
[46] sf_0.7-4            parallelMap_1.3     purrr_0.2.5
[49] mlrMBO_1.1.2        smoof_1.5.1         checkmate_1.8.5
[52] BBmisc_1.11         magrittr_1.5        mlr_2.13.9000
[55] ParamHelpers_1.11   drake_7.3.0.9000

loaded via a namespace (and not attached):
  [1] backports_1.1.2   Hmisc_4.2-0       fastmatch_1.1-0
  [4] igraph_1.2.2      lazyeval_0.2.1    splines_3.5.1
  [7] storr_1.2.1       listenv_0.7.0     digest_0.6.15
 [10] htmltools_0.3.6   base64url_1.4     cluster_2.0.7-1
 [13] readr_1.3.1       globals_0.12.4    extrafont_0.17
 [16] extrafontdb_1.0   xts_0.11-0        colorspace_1.3-2
 [19] rvest_0.3.2       pixmap_0.4-11     xfun_0.7
 [22] callr_3.1.0       crayon_1.3.4      jsonlite_1.5
 [25] hexbin_1.27.2     survival_2.42-3   zoo_1.8-3
 [28] gtable_0.2.0      webshot_0.5.1     Rttf2pt1_1.3.7
 [31] scales_1.0.0      DBI_1.0.0         miniUI_0.1.1.1
 [34] Rcpp_1.0.0        plotrix_3.7-4     spData_0.2.9.0
 [37] htmlTable_1.12    units_0.6-2       Formula_1.2-3
 [40] intervals_0.15.1  dismo_1.1-4       htmlwidgets_1.3
 [43] httr_1.3.1        FNN_1.1           aqp_1.17
 [46] acepack_1.4.1     pkgconfig_2.0.2   reshape_0.8.8
 [49] XML_3.98-1.16     nnet_7.3-12       RJSONIO_1.3-1.1
 [52] labeling_0.3      later_0.7.5       rlang_0.3.1
 [55] munsell_0.5.0     tools_3.5.1       cli_1.1.0
 [58] evaluate_0.13     yaml_2.2.0        processx_3.2.1
 [61] knitr_1.23        mime_0.5          whisker_0.3-2
 [64] xml2_1.2.0        compiler_3.5.1    rstudioapi_0.10
 [67] plotly_4.8.0      e1071_1.7-0       spacetime_1.2-2
 [70] lhs_0.16          stringi_1.2.4     ps_1.2.1
 [73] gdtools_0.1.7     plot3D_1.1.1      Matrix_1.2-14
 [76] classInt_0.2-3    pillar_1.3.1      plotKML_0.5-9
 [79] data.table_1.11.8 httpuv_1.4.5      colorRamps_2.3
 [82] R6_2.2.2          promises_1.0.1    gridExtra_2.3
 [85] codetools_0.2-15  MASS_7.3-50       assertthat_0.2.0
 [88] rprojroot_1.3-2   withr_2.1.2       hms_0.4.2
 [91] parallel_3.5.1    grid_3.5.1        rpart_4.1-13
 [94] tidyr_0.8.2       class_7.3-14      rmarkdown_1.12
 [97] misc3d_0.8-4      mco_1.0-15.1      git2r_0.23.0
[100] shiny_1.2.0       base64enc_0.1-3